Inflation and the policy response in 2022
As the inflation debate continues, it’s worth reiterating some important points that policymakers should keep in mind in coming months as they ponder what to do about inflation that emerged last year.
- The argument that too-generous fiscal relief and recovery efforts played a large role in the 2021 acceleration of inflation by overheating the economy is weak, even after accounting for rapid growth in the last quarter of 2021.
- The COVID-19 pandemic is the primary factor driving excessive inflation through demand and supply-side distortions. Going forward, the economic distortions imposed by COVID-19 are highly likely to become less extreme in 2022, providing relief on inflation.
- The worry that inflation “expectations” among workers, households, and businesses will become embedded and keep inflation high is misplaced. What matters more than “expectations” of higher inflation is the leverage workers and firms have to protect their incomes from inflation. For decades this leverage has been entirely one-sided, with workers having very little ability to protect wages against price pressures. This one-sided leverage will stem upward pressure on wages in coming months and this will dampen inflation.
- Moderate interest rate hikes will not slow inflation by themselves. The benefit of these hikes in convincing households and businesses that inflation is taken seriously by policymakers needs to be weighed against their possible downsides in slowing growth.
Inflation in 2021 was not driven by generalized macroeconomic overheating
Dean Baker recently authored a strong post surveying the evidence about inflation and macroeconomic overheating. I’ll just add one or two points to his argument. In the last quarter of 2021, rapid growth in gross domestic product (GDP) pushed it 3.1% above the level it had reached in the last quarter of 2019 (the last quarter unaffected by COVID-19).
Should this level of GDP have put severe stress on the economy’s ability to produce it without inflation? Not really—inflation was low (and falling) in 2019. The economy’s supply side has been damaged since 2019, but it’s easy to overstate this damage. While employment was down 1.8% in the last quarter of 2021 relative to 2019, total hours worked in the economy is only down 0.7% (and Baker notes in his post that including growth in self-employed hours would reduce this to 0.4%). While some of this is due to people working longer hours than they did pre-pandemic, most of it is due to the fact that the jobs that have yet to return following the COVID-19 shock are much lower-hour jobs than average. Since labor is only about 60% of the inputs into production, the 0.4% decline in economy-side hours would only generate about a 0.2% decline in output, all else equal.
Could other parts of the economy’s supply side have grown 3% over the past two years to generate enough capacity to produce the level of GDP we saw at the end of 2021 without inflation? Absolutely. Trend productivity growth between 2007 and 2019 would easily get you there (it averaged 1.4% annually). The component of productivity growth that we measure with any plausibility—business investment—has actually grown at an extremely rapid rate, posting 7.4% growth in 2021 compared with 4.3% growth in 2019. Non-residential fixed investment (NRFI) has been quite strong over the past year.
Pre-COVID trend growth in total factor productivity (a proxy—albeit not a great one—for efficiency gains stemming from technological or managerial innovation) alone would’ve added about 1.3% to potential GDP since 2019. And if even a small part of the enormous contraction in commuting time ended up as unmeasured increases in working time, then this would represent a large boost to the economy’s supply side.
Late last week, real-time measures of productivity growth for the fourth quarter of 2021 indicated rapid 6.6% annualized growth. Granted, productivity data is volatile quarter-to-quarter. But since the end of 2019, productivity growth has surpassed even its pre-COVID-19 trend, which means that the inflation of 2021 seems far out of line with what would be implied by any mismatch in aggregate demand and supply for that year. This is particularly important given claims that the significant fiscal relief enacted at the beginning of 2021 clearly overheated the economy by pushing aggregate demand well ahead of supply. As we have noted before, the data continue to show that the evidence for a macroeconomic imbalance of demand and supply being the primary driver of inflation is very weak.
Inflation was driven by COVID-19 distortions to the economy
While the overall level of GDP was not inconsistent with the economy’s supply-side capacity to deliver it without inflation, its composition was not. To a historically unprecedented degree, spending shifted into goods consumption and residential investment, moving away from services and government. The figure below shows the one-year change in the share of nominal GDP accounted for by goods and residential investment.
Pandemic caused unprecedented spike in demand for goods and residential investment: 4-quarter change in share of GDP accounted for by goods consumption and residential investment
| Year | 4-quarter change in share of GDP accounted for by goods consumption and residential investment |
|---|---|
| 1955 Q1 | 0.88% |
| 1955 Q2 | 0.70% |
| 1955 Q3 | 0.35% |
| 1955 Q4 | -0.52% |
| 1956 Q1 | -1.10% |
| 1956 Q2 | -1.65% |
| 1956 Q3 | -1.63% |
| 1956 Q4 | -1.23% |
| 1957 Q1 | -1.09% |
| 1957 Q2 | -0.94% |
| 1957 Q3 | -0.70% |
| 1957 Q4 | -0.29% |
| 1958 Q1 | 0.10% |
| 1958 Q2 | 0.00% |
| 1958 Q3 | -0.17% |
| 1958 Q4 | -0.44% |
| 1959 Q1 | 0.15% |
| 1959 Q2 | 0.25% |
| 1959 Q3 | 0.56% |
| 1959 Q4 | 0.07% |
| 1960 Q1 | -1.19% |
| 1960 Q2 | -0.76% |
| 1960 Q3 | -1.44% |
| 1960 Q4 | -0.56% |
| 1961 Q1 | -0.64% |
| 1961 Q2 | -1.25% |
| 1961 Q3 | -0.85% |
| 1961 Q4 | -1.17% |
| 1962 Q1 | -0.86% |
| 1962 Q2 | -0.41% |
| 1962 Q3 | -0.38% |
| 1962 Q4 | -0.02% |
| 1963 Q1 | 0.22% |
| 1963 Q2 | 0.21% |
| 1963 Q3 | 0.13% |
| 1963 Q4 | -0.37% |
| 1964 Q1 | -0.07% |
| 1964 Q2 | -0.21% |
| 1964 Q3 | 0.07% |
| 1964 Q4 | -0.19% |
| 1965 Q1 | -0.39% |
| 1965 Q2 | -0.54% |
| 1965 Q3 | -0.73% |
| 1965 Q4 | -0.18% |
| 1966 Q1 | -0.40% |
| 1966 Q2 | -0.76% |
| 1966 Q3 | -0.73% |
| 1966 Q4 | -1.65% |
| 1967 Q1 | -1.97% |
| 1967 Q2 | -0.62% |
| 1967 Q3 | -0.65% |
| 1967 Q4 | 0.16% |
| 1968 Q1 | 0.87% |
| 1968 Q2 | -0.02% |
| 1968 Q3 | 0.65% |
| 1968 Q4 | 0.50% |
| 1969 Q1 | 0.22% |
| 1969 Q2 | 0.16% |
| 1969 Q3 | -0.65% |
| 1969 Q4 | -0.64% |
| 1970 Q1 | -0.68% |
| 1970 Q2 | -0.84% |
| 1970 Q3 | -0.59% |
| 1970 Q4 | -0.11% |
| 1971 Q1 | -0.02% |
| 1971 Q2 | 0.69% |
| 1971 Q3 | 0.80% |
| 1971 Q4 | 0.96% |
| 1972 Q1 | 0.78% |
| 1972 Q2 | 0.36% |
| 1972 Q3 | 0.53% |
| 1972 Q4 | 0.42% |
| 1973 Q1 | 0.75% |
| 1973 Q2 | 0.07% |
| 1973 Q3 | -0.10% |
| 1973 Q4 | -1.30% |
| 1974 Q1 | -1.37% |
| 1974 Q2 | -0.78% |
| 1974 Q3 | -0.49% |
| 1974 Q4 | -1.39% |
| 1975 Q1 | -1.32% |
| 1975 Q2 | -0.95% |
| 1975 Q3 | -0.86% |
| 1975 Q4 | 0.68% |
| 1976 Q1 | 0.82% |
| 1976 Q2 | 0.65% |
| 1976 Q3 | 0.24% |
| 1976 Q4 | 0.96% |
| 1977 Q1 | 0.76% |
| 1977 Q2 | 0.83% |
| 1977 Q3 | 0.50% |
| 1977 Q4 | 0.27% |
| 1978 Q1 | 0.00% |
| 1978 Q2 | -0.28% |
| 1978 Q3 | -0.16% |
| 1978 Q4 | -0.68% |
| 1979 Q1 | -0.56% |
| 1979 Q2 | -0.66% |
| 1979 Q3 | -0.13% |
| 1979 Q4 | -0.17% |
| 1980 Q1 | -0.35% |
| 1980 Q2 | -1.58% |
| 1980 Q3 | -1.49% |
| 1980 Q4 | -1.31% |
| 1981 Q1 | -1.48% |
| 1981 Q2 | -0.39% |
| 1981 Q3 | -1.50% |
| 1981 Q4 | -2.24% |
| 1982 Q1 | -1.51% |
| 1982 Q2 | -1.71% |
| 1982 Q3 | -0.88% |
| 1982 Q4 | 0.43% |
| 1983 Q1 | 0.23% |
| 1983 Q2 | 1.35% |
| 1983 Q3 | 1.49% |
| 1983 Q4 | 0.99% |
| 1984 Q1 | 0.68% |
| 1984 Q2 | 0.07% |
| 1984 Q3 | -0.70% |
| 1984 Q4 | -0.67% |
| 1985 Q1 | -0.49% |
| 1985 Q2 | -0.51% |
| 1985 Q3 | 0.17% |
| 1985 Q4 | -0.12% |
| 1986 Q1 | 0.00% |
| 1986 Q2 | 0.22% |
| 1986 Q3 | 0.67% |
| 1986 Q4 | 0.71% |
| 1987 Q1 | 0.13% |
| 1987 Q2 | 0.22% |
| 1987 Q3 | -0.29% |
| 1987 Q4 | -0.90% |
| 1988 Q1 | -0.25% |
| 1988 Q2 | -0.75% |
| 1988 Q3 | -1.09% |
| 1988 Q4 | -0.28% |
| 1989 Q1 | -0.79% |
| 1989 Q2 | -0.61% |
| 1989 Q3 | -0.46% |
| 1989 Q4 | -0.77% |
| 1990 Q1 | -0.21% |
| 1990 Q2 | -0.91% |
| 1990 Q3 | -1.02% |
| 1990 Q4 | -0.83% |
| 1991 Q1 | -1.62% |
| 1991 Q2 | -0.98% |
| 1991 Q3 | -0.82% |
| 1991 Q4 | -1.07% |
| 1992 Q1 | -0.19% |
| 1992 Q2 | -0.15% |
| 1992 Q3 | -0.12% |
| 1992 Q4 | 0.34% |
| 1993 Q1 | 0.00% |
| 1993 Q2 | 0.24% |
| 1993 Q3 | 0.35% |
| 1993 Q4 | 0.38% |
| 1994 Q1 | 0.49% |
| 1994 Q2 | 0.27% |
| 1994 Q3 | 0.26% |
| 1994 Q4 | 0.12% |
| 1995 Q1 | -0.35% |
| 1995 Q2 | -0.42% |
| 1995 Q3 | -0.43% |
| 1995 Q4 | -0.41% |
| 1996 Q1 | 0.11% |
| 1996 Q2 | 0.42% |
| 1996 Q3 | 0.15% |
| 1996 Q4 | 0.06% |
| 1997 Q1 | -0.03% |
| 1997 Q2 | -0.80% |
| 1997 Q3 | -0.47% |
| 1997 Q4 | -0.35% |
| 1998 Q1 | -0.61% |
| 1998 Q2 | 0.33% |
| 1998 Q3 | 0.23% |
| 1998 Q4 | 0.48% |
| 1999 Q1 | 0.67% |
| 1999 Q2 | 0.81% |
| 1999 Q3 | 0.75% |
| 1999 Q4 | 0.40% |
| 2000 Q1 | 0.79% |
| 2000 Q2 | -0.15% |
| 2000 Q3 | -0.07% |
| 2000 Q4 | -0.05% |
| 2001 Q1 | -0.35% |
| 2001 Q2 | -0.03% |
| 2001 Q3 | 0.05% |
| 2001 Q4 | 0.51% |
| 2002 Q1 | 0.13% |
| 2002 Q2 | 0.35% |
| 2002 Q3 | 0.26% |
| 2002 Q4 | -0.09% |
| 2003 Q1 | 0.41% |
| 2003 Q2 | 0.23% |
| 2003 Q3 | 0.62% |
| 2003 Q4 | 0.51% |
| 2004 Q1 | 0.61% |
| 2004 Q2 | 0.74% |
| 2004 Q3 | 0.31% |
| 2004 Q4 | 0.61% |
| 2005 Q1 | 0.13% |
| 2005 Q2 | 0.37% |
| 2005 Q3 | 0.67% |
| 2005 Q4 | 0.10% |
| 2006 Q1 | 0.20% |
| 2006 Q2 | -0.48% |
| 2006 Q3 | -1.06% |
| 2006 Q4 | -1.40% |
| 2007 Q1 | -1.54% |
| 2007 Q2 | -1.44% |
| 2007 Q3 | -1.64% |
| 2007 Q4 | -1.31% |
| 2008 Q1 | -1.54% |
| 2008 Q2 | -1.48% |
| 2008 Q3 | -1.42% |
| 2008 Q4 | -2.67% |
| 2009 Q1 | -2.59% |
| 2009 Q2 | -2.39% |
| 2009 Q3 | -1.37% |
| 2009 Q4 | -0.06% |
| 2010 Q1 | 0.27% |
| 2010 Q2 | 0.21% |
| 2010 Q3 | -0.76% |
| 2010 Q4 | -0.15% |
| 2011 Q1 | 0.31% |
| 2011 Q2 | 0.38% |
| 2011 Q3 | 0.70% |
| 2011 Q4 | 0.34% |
| 2012 Q1 | 0.16% |
| 2012 Q2 | -0.10% |
| 2012 Q3 | -0.07% |
| 2012 Q4 | 0.23% |
| 2013 Q1 | 0.20% |
| 2013 Q2 | 0.29% |
| 2013 Q3 | 0.24% |
| 2013 Q4 | -0.18% |
| 2014 Q1 | -0.15% |
| 2014 Q2 | 0.08% |
| 2014 Q3 | 0.02% |
| 2014 Q4 | 0.16% |
| 2015 Q1 | -0.35% |
| 2015 Q2 | -0.26% |
| 2015 Q3 | -0.01% |
| 2015 Q4 | -0.08% |
| 2016 Q1 | 0.21% |
| 2016 Q2 | 0.13% |
| 2016 Q3 | -0.08% |
| 2016 Q4 | 0.01% |
| 2017 Q1 | 0.19% |
| 2017 Q2 | 0.08% |
| 2017 Q3 | 0.08% |
| 2017 Q4 | 0.28% |
| 2018 Q1 | 0.00% |
| 2018 Q2 | -0.02% |
| 2018 Q3 | -0.10% |
| 2018 Q4 | -0.48% |
| 2019 Q1 | -0.59% |
| 2019 Q2 | -0.36% |
| 2019 Q3 | -0.26% |
| 2019 Q4 | -0.14% |
| 2020 Q1 | 0.49% |
| 2020 Q2 | 1.59% |
| 2020 Q3 | 2.56% |
| 2020 Q4 | 2.58% |
| 2021 Q1 | 3.48% |
| 2021 Q2 | 2.59% |
| 2021 Q3 | 1.02% |
| 2021 Q4 | 0.83% |
Note: Data from National Income and Product Accounts (NIPA) of the Bureau of Economic Analysis (BEA).
The source of this huge reallocation of demand away from face-to-face services is obviously COVID-19. At the same time as this reallocation in demand occurred, global supply chains snarled due largely to port shutdowns caused by COVID-19 outbreaks. These COVID-19 distortions on both the demand and supply sides are the sources of 2021’s inflation.
Most sources of inflationary pressure are set to relent in 2022
Of course, the supply/demand imbalance in COVID-19-distorted sectors could have been lessened if macroeconomic policy had been more contractionary and less relief was provided earlier in 2021. This would’ve led to lower inflation. But it also would have led to slower job growth in the sectors of the economy that were not severely pinched by the supply side. Job growth in these sectors fueled the historically large gain of 6.5 million jobs in 2021.
Even if one was solely concerned with slowing inflation and didn’t care at all about other macroeconomic variables (like job creation), the boost to aggregate demand coming from fiscal policy is going to be sharply reduced in 2022. If you thought expansionary fiscal policy was the most important contributor to inflation, you should hence expect far less inflationary pressure stemming from this influence going forward.
There are also many reasons to think that the global supply chain dysfunction may be near a plateau. Of course, given the unpredictability ofCOVID-19, it’s hard to definitively declare this. But between continued global vaccine rollout and a growing disconnect between COVID-19 waves and economic disruption, there is decent reason to think pressure from global supply chain kinks may start to resolve in the coming year.
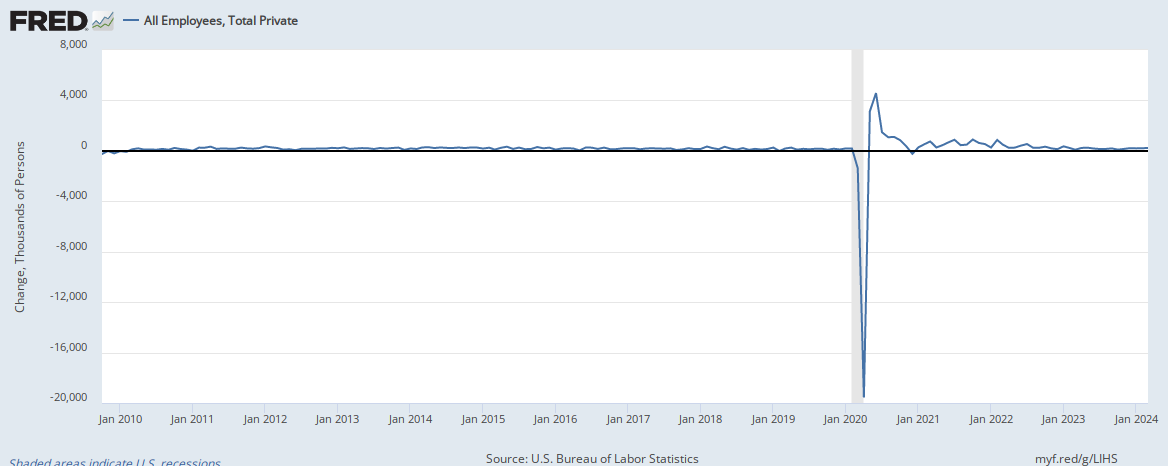
Last week’s monthly jobs data provided a clear sign of the growing disconnect between COVID-19 cases and economic activity. Despite the Omicron wave which spiked cases well over twice as high as any previous COVID-19 wave, monthly job growth in January was strong. with 444,000 new private-sector jobs created, far more than were created in any single month during the recovery following the Great Recession of 2008–09.
Further, pressure on the supply chain imposed by rapid growth in durable goods demand in the United States is almost surely going to relent. extremely strong demand for durable goods in 2021 will put some downward pressure on this demand in 2022. The intuition is simple: durable goods are durable. Nobody buys a new couch or car every single year.
Leverage, not just expectations, is the inflation amplifier
A commonly expressed worry is that the recent bout of high inflation will reset the expectations of workers, households, and businesses, and hence inflation going forward will have strong inertia. The role of expectations in driving inflation inertia is highly contested, however. In his recent post, Dean Baker highlights a number of market-based indicators of inflationary expectations that have not appreciably accelerated. An obvious example is 10-year Treasury yields. If there were widespread expectations that the inflation of 2021 would largely continue in coming years, investors would need a higher interest rate to induce them to keep buying U.S. treasury bonds. But the increase in Treasury interest rates over the past nine months has been quite small—well less than 1 percentage point. It does not seem like financial market participants are expecting a sustained higher pace of inflation in coming years.
More fundamentally, however, the inertia embedded in an inflationary shock is less about the expectations of workers and firms and more about the leverage they have to protect their incomes from inflation. If workers have weak bargaining power and leverage, then any inflationary shock stemming from non-wage factors (like the current outbreak) will just put downward pressure on real wages instead of being passed forward through very rapid wage growth. Given the past generation has seen relentless policy attacks on workers’ leverage, it seems highly likely that the labor market will dampen, not amplify, inflationary pressures regardless of what workers expect.
Currently, significant swathes of the labor market seem to be pretty tight, and nominal wage growth has been rapid relative to recent history. But much of this tightness stems from factors—like the current wave of the COVID-19 pandemic—that could fade quickly. Further, many of the sectors with rapid wage growth recently have seen a pronounced deceleration in recent months. Finally, as fast as nominal wage growth has been in recent quarters, it still is not fast enough to put upward pressure on prices. So long as nominal wages are growing more slowly than the sum of price inflation and trend productivity growth, there is no upward pressure on prices coming from the labor market. The most obvious way to see this is in the historically high profit margins registered in recent quarters.
How effective will interest rate hikes be in stemming inflation? Are there downsides to raising rates?
While there is suggestive evidence that inflation will begin decelerating quickly on its own by mid-2022, mounting pressure on the Federal Reserve to demonstrate anti-inflationary commitment means that it would be a shock if they do not raise interest rates 0.25% in March, and nearly as big a shock if they don’t follow that up with another 0.25% increase in June. A scenario where the Fed undertakes these modest interest rate hikes and inflation quickly decelerates without a slowdown in economic growth is certainly possible, maybe even the most likely one.
But there’s also a scenario where even a modest hike leaves us later in 2022 with growth constrained by too-slack demand. And there’s an even worse scenario where modest hikes that don’t appreciably slow growth at first lead to even more pressure to keep raising interest rates to beat inflation down more quickly. This would almost surely lead to an overshoot and progress in reducing unemployment stalled (or even reversed).
Higher interest rates will only make a contribution to lower inflation if they meaningfully slow demand growth relative to the baseline. Some argue that rate hikes can work to reduce inflation without putting downward pressure on growth by working through the “expectations channel”: If workers and businesses see the Fed is serious about not letting future inflation run out of control, they will expect less inflation going forward and will have no need to try to push up their own nominal incomes (either through higher wages or profit margins), and hence inflationary inertia will be sapped, all painlessly.
Given this, it is tempting to argue that small, moderately paced interest rate hikes in March and June will put very little downward pressure on demand –growth and further, that growth in those periods is as likely to be constrained by supply-side developments as demand-side. If these small, non-binding rate cuts are followed by a deceleration in inflation—even one that would’ve happened in their absence—what’s the harm? The Fed’s reputation as an inflation fighter would be buttressed and growth would continue apace.
While that scenario is a quite-likely outcome, it’s not riskless. As we noted before, key sources of demand growth will slow significantly in 2022, and many current supply constraints could quickly unkink. Further, an important channel through which higher interest rates might impinge on demand growth runs through their effect on business investment. As we noted before, business investment has been extremely strong over the past year, after an entire business cycle when business investment was extraordinarily weak. It has also fallen quickly in the recent past when interest rates were hiked very modestly.
The inflation spike of 2021 has been bad for typical families and is a real policy challenge. But it remains the case that an overreaction to it could end up causing the most damage of all.
Enjoyed this post?
Sign up for EPI's newsletter so you never miss our research and insights on ways to make the economy work better for everyone.