How underpaid are teachers in your state?: Depending on the state, teachers make between 3.4% and 35.9% less than other comparable college-educated workers
| State | Teacher weekly pay penalty |
|---|---|
| Colorado | -35.9% |
| Oklahoma | -32.8% |
| Virginia | -32.7% |
| Arizona | -32.0% |
| Alabama | -30.6% |
| Oregon | -29.4% |
| Washington | -29.1% |
| Missouri | -28.3% |
| Louisiana | -27.8% |
| New Mexico | -27.4% |
| Georgia | -26.8% |
| Minnesota | -25.9% |
| Idaho | -25.2% |
| Kentucky | -24.7% |
| North Carolina | -24.5% |
| Maine | -24.0% |
| Tennessee | -23.8% |
| Illinois | -23.4% |
| Kansas | -22.6% |
| Utah | -22.5% |
| Wisconsin | -22.2% |
| Texas | -21.5% |
| Indiana | -21.4% |
| Nebraska | -20.7% |
| Arkansas | -20.5% |
| Massachusetts | -20.5% |
| Nevada | -20.4% |
| Maryland | -20.3% |
| New Hampshire | -19.9% |
| Florida | -19.6% |
| West Virginia | -19.2% |
| District of Columbia | -19.0% |
| Michigan | -18.4% |
| South Dakota | -17.9% |
| North Dakota | -17.8% |
| California | -17.6% |
| Connecticut | -17.1% |
| Montana | -17.0% |
| Iowa | -16.3% |
| Hawaii | -15.5% |
| Pennsylvania | -15.2% |
| Alaska | -14.9% |
| Mississippi | -14.7% |
| Ohio | -14.4% |
| Vermont | -13.6% |
| New York | -13.2% |
| Delaware | -10.9% |
| South Carolina | -8.3% |
| New Jersey | -4.5% |
| Wyoming | -4.0% |
| Rhode Island | -3.4% |
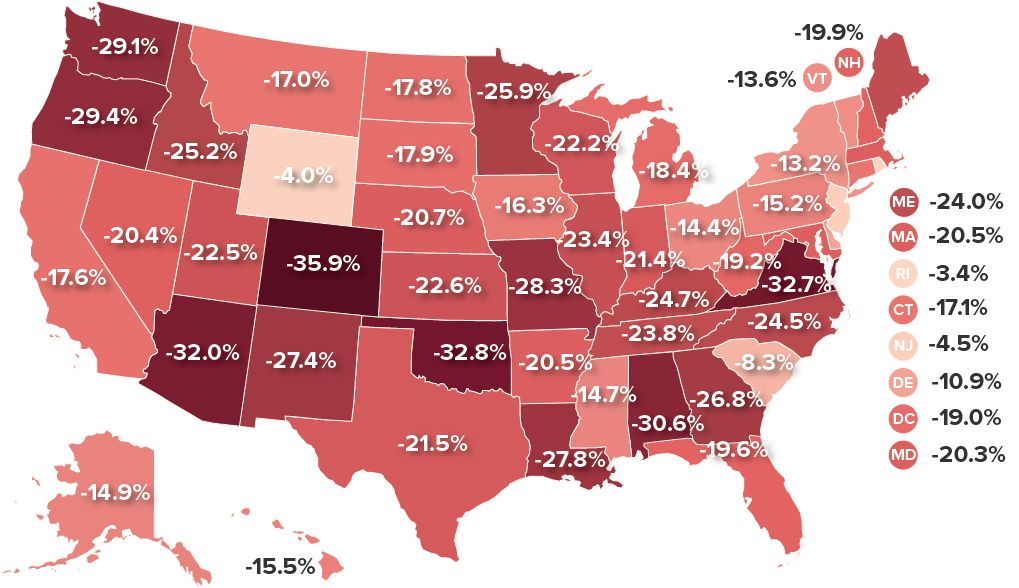
Notes: Figure shows state-specific regression-adjusted weekly wage penalties for public school teachers (elementary, middle, and secondary) relative to their college-educated, nonteaching peers. See Allegretto and Mishel 2019, Appendix A, for more details on data and methodology.
Figure reports state-specific regression-adjusted teacher weekly wage penalties: how much less, in percentage terms, public school teachers (elementary, middle, and secondary) earn in weekly wages relative to their college-educated, nonteaching peers. College-educated workers refers to workers who have a bachelor’s degree or more education. The dependent variable is (log) weekly wages with indicator controls on public school teacher, public school teacher interacted with each state (relevant estimate), private school teacher, gender, and married, along with indicator sets on education (M.A., professional degree, Ph.D.) and race/ethnicity (Black, Hispanic, other); also included are age as a quartic, state fixed effects. See Allegretto and Mishel 2019, Appendix A, for more details on data and methodology.
Source: Author’s analysis of pooled 2016–2021 Current Population Survey Outgoing Rotation Group data accessed via the EPI Current Population Survey Extracts, Version 1.0.29 (EPI 2022a), https://microdata.epi.org.