Dear Members of the Joint Committee on Labor and Workforce Development:
I am writing to provide testimony on HB 1979 and SB 1205, which are nearly identical bills both entitled An Act establishing fairness for agricultural workers (also referred to as the Fairness for Farmworkers Act), and which would implement much needed reforms that would allow farmworkers to begin to be entitled to overtime pay in certain circumstances, although it would still fall short of the overtime pay that most workers are entitled to. The bill would also eliminate the Massachusetts state sub-minimum wage for agriculture, which allows employers to pay farmworkers $8.50 per hour rather than the normal state minimum wage of $13.50.
I have researched and written about farm labor issues, including wages, labor standards, and worksite enforcement, for over 11 years at the Economic Policy Institute (EPI). Some of my past reports are included in the footnotes of this testimony.
While there is limited available evidence regarding the impact of overtime pay in agriculture, basic data on the agricultural economy in the nation’s biggest and most important farm state—California—strongly suggests that overtime pay for farmworkers has not corresponded with any negative impacts or shocks to the California farm economy or labor market. This testimony will present some of the that information, which suggests that overtime pay for farmworkers in Massachusetts will not lead to the negative outcomes that agribusiness representatives appear to be claiming—largely without evidence—will result. The testimony will also argue that eliminating the agricultural subminimum wage will not be unreasonably costly, with minimal costs that could be passed onto consumers or shared between consumers and employers.
Farmworkers are a precarious workforce, with few rights or access to justice
The coronavirus pandemic and the ensuing economic collapse was a difficult time for many workers and families, with hundreds of thousands of deaths and widespread human suffering. While millions of workers were allowed to remain home and work remotely in order to stay safe, the vast majority of workers did not have a remote work option, either because employers did not permit it or because it was simply not feasible.1 One key segment of the workforce that was expected to keep working in order to sustain the food supply chain—but at great risk to themselves and their families—were farmworkers.
Even before the pandemic, farmworkers were employed in one of the most hazardous jobs in the entire U.S. labor market,2 and as EPI research has shown, they suffer very high rates of wage and hour violations.3 In addition, most farmworkers in the United States either lack an immigration status or are employed via a precarious, temporary status through the H-2A visa program. The lack of an immigration status, or having only a temporary status, means that unauthorized and H-2A farmworkers are even worse off because they have limited labor rights, which increases their vulnerability to wage theft and other abuses.4
Unauthorized immigrants who speak up about unfair treatment or abuse in the workplace risk employer retaliation in the form of deportation. In the case of temporary migrant farmworkers employed though the H-2A visa program, H-2A workers are not permitted to change employers and are thus practically indentured to them.5 The half of farmworkers who are unauthorized plus 10% of farmworkers with H-2A visas mean that only 40% of the farm workforce are U.S. citizens and legal immigrants with full rights and agency in the labor market. Having the majority of the farm workforce employed without basic workplace rights in turn puts downward pressure on labor standards for all workers.
Farmworkers provide an essential service but are vastly underpaid
As EPI research has also demonstrated, farmworkers are among the lowest-paid workers in the entire U.S. workforce, even lower than other comparable low-wage workers. As Figure A shows, farmworkers earned just $14.62 per hour on average in 2020, which is just 60%—or three fifths—of what production and nonsupervisory nonfarm workers earned ($24.67), who are the most appropriate cohort of workers outside of agriculture to compare with farmworkers.6
The farmworker wage gap in 2020: Farmworkers earn very low wages compared with other workers: Average hourly wage rate for farmworkers and H-2A workers compared with average hourly wages of other workers, 2020
| Type | Amount | |
|---|---|---|
| H-2A farmworkers | $13.68 | |
| Nonsupervisory farmworkers | $14.62 | |
| Workers with less than HS | $15.06 | |
| Workers with HS diploma only | $20.09 | |
| Nonsupervisory nonfarm | $24.67 | |
| All workers | $28.78 | |
Notes: All values are for 2020 and in 2020 dollars. HS = high school. H-2A wage is the national average Adverse Effect Wage Rate for 2020, as reported by the U.S. Department of Labor, and does not reflect the average wage paid to the H-2A workers who were ultimately employed in 2020. Nonsupervisory nonfarm workers’ wage represents the average hourly earnings of production and nonsupervisory employees, total for the private sector, not seasonally adjusted. Nonsupervisory farmworkers’ wage is the gross average hourly wage of field and livestock workers. Data for all workers, and for workers with a high school diploma and less than high school, can be found at the Economic Policy Institute State of Working America Data Library. The H-2A visa program is described by the U.S. Department of Labor as a "temporary agricultural program [that] allows agricultural employers who anticipate a shortage of domestic workers to bring nonimmigrant foreign workers to the U.S. to perform agricultural labor or services of a temporary or seasonal nature."
Sources: Author’s analysis of USDA Farm Labor Survey data and nonfarm wage data from the BLS Current Employment Statistics survey; EPI analysis of CPI-ORG microdata; Office of Foreign Labor Certification historical state AEWRs
Author’s analysis of USDA, Economic Research Service using data from National Agricultural Statistics Service, Farm Labor Survey, and nonfarm wage data are from Bureau of Labor Statistics, Current Employment Statistics survey; EPI analysis of Current Population Survey Outgoing Rotation Group microdata (Economic Policy Institute, State of Working America Data Library); Office of Foreign Labor Certification, “Historical State AEWRs: Adverse Effect Wage Rate by State from 2014 to Present,” U.S. Department of Labor.
Farmworkers have very low levels of educational attainment, nevertheless, they still earned even less than the two groups of workers with the lowest levels of education in the United States: Figure A also shows that nonsupervisory farmworkers at $14.62 per hour earned 44 cents per hour less than the average wage earned by all workers without a high school diploma ($15.06), and farmworkers earned roughly $5 less per hour than the average wage earned by all workers with only a high school diploma ($20.09).
Many farmworkers employed through the H-2A visas program fared even worse. Figure A shows that the wage paid to most farmworkers with H-2A visas—known as the Adverse Effect Wage Rate (AEWR)—was even lower, with a national average of $13.68 per hour, according to the U.S. Department of Labor. But many H-2A farmworkers earned far less in some of the biggest H-2A states. In Florida and Georgia—where a quarter of all H-2A jobs were located in 2020—H-2A workers were paid the lowest state AEWR, at $11.71 per hour.
These data prove that the claim which is often made and repeated by farm employers and agribusiness lobbyists and representatives—i.e., that wages are rising too quickly for farmworkers and that the AEWR for H-2A workers is too high and rising too quickly, and thus not consistent with labor market trends—is not credible and not based on any data or evidence.
Overtime protections for farmworkers in California: Current law requires overtime pay after 8 hours per day or 40 hours per week
California’s Assembly Bill (AB) 1066 (2016) created a timetable for workers employed in agriculture workers to receive overtime pay on the same basis as workers in most other industries—in other words, time and a half after 8 hours per day or 40 hours per week—but AB 1066 created a specified phase-in period so that employers could have time to adjust to the new rules, meaning farmworkers would gradually receive overtime pay over a four year period, depending on the number of hours they worked.
The preamble to AB 1066 summarizes the updated overtime rule for farmworkers:
This bill would remove the exemption for agricultural employees regarding hours, meal breaks, and other working conditions, including specified wage requirements, and would create a schedule that would phase in overtime requirements for agricultural workers, as defined, over the course of 4 years, from 2019 to 2022, inclusive. Beginning January 1, 2022, the bill would require any work performed by a person, employed in an agricultural occupation, in excess of 12 hours in one day to be compensated at the rate of no less than twice the employee’s regular rate of pay. The bill would provide employers who employ 25 or fewer employees an additional 3 years to comply with the phasing in of these overtime requirements.7
The hours worked per day or per week before farmworkers are eligible for overtime pay, i.e. at a rate of one and one-half times the employee’s regular rate of pay, is phasing-in according to the schedule shown in Figure B, which comes from the California Department of Industrial relations.
Overtime for California farmworkers is phased-in over a four-year period, between 2019 and 2022
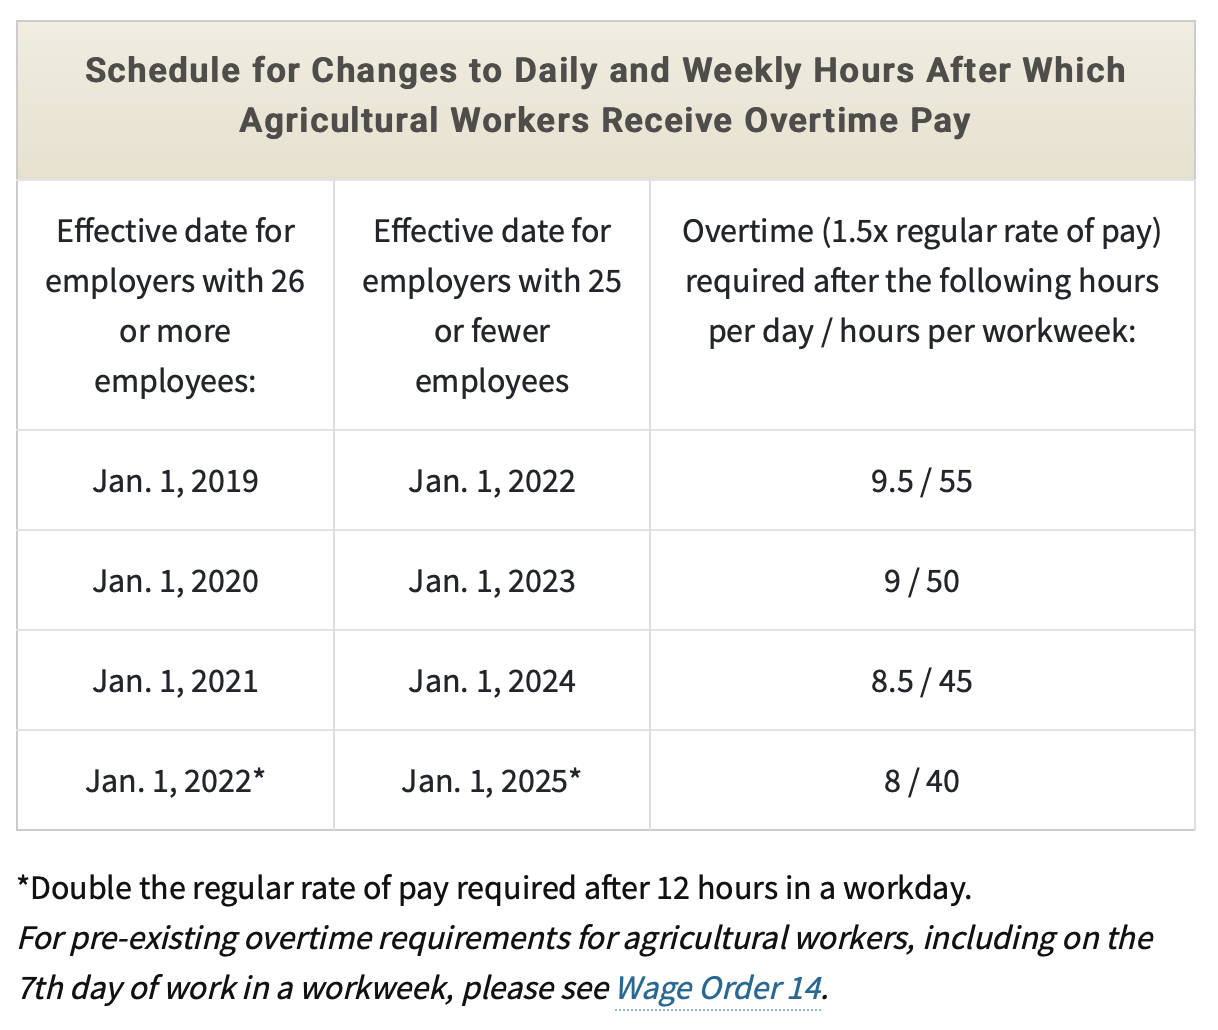
Notes: The image in this figure is a copy of the original, created by the California Department of Industrial Relations (see Source).
Source: Labor Commissioner's Office, "Overtime for Agricultural Workers," California Department of Industrial Relations, January 2019.
For nearly three years, farmworkers in California have been entitled to overtime pay. The overtime threshold for farmworkers in 2021 has been 8.5 hours per day or 45 hours per week, and on January 1, 2022, it will be on par with the overtime threshold in other industries. In addition, as noted in Figure B, next year in California, any farmworker who works more than 12 hours in one day must be paid twice the amount of their regular rate of pay.
California’s farm economy and labor market indicators have held steady since implementation of the state requirement that farmworkers be paid overtime
While there is limited available evidence regarding the impact of overtime pay in agriculture, basic data on the agricultural economy in the nation’s biggest and most important farm state—California—strongly suggests that overtime pay for farmworkers has not corresponded with any negative impacts or shocks to the California farm economy or labor market. This section discusses three key indicators.
1. Average hours worked by farmworkers in California have remained constant during the overtime phase in period
The U.S. Department of Agriculture’s (USDA) Farm Labor Survey8 provides an important source of information on wages paid to U.S. farmworkers and hours worked by them. Data published by USDA on the average of hours worked per week by farmworkers on California farms—before and after enactment and implementation of the AB 1066 farmworker overtime law—shows that the number of hours worked remained virtually unchanged.
Table 1 shows that between 2014 and 2018, the five years preceding the overtime phase-in period mandated by AB 1066, California’s farmworkers worked an average of 42.8 hours per week. In the two years that AB 1066’s overtime provisions have been in effect, farmworkers worked an average of 42.3 hours per week, just a half hour difference from the preceding five years.
Thus, in the five years before AB 1066’s phased-in overtime provisions went into effect, as well as during the two years of 2019 and 2020, when the phased-in overtime law was in effect, hours worked have remained steady, suggesting that California’s overtime pay requirement has not correlated with a change in the number of hours worked by California’s farmworkers.
USDA survey data shows average weekly work hours for California farmworkers remained constant after implementation of state overtime law
| Year | Hours worked per week |
|---|---|
| 2014 | 42.8 |
| 2015 | 42.7 |
| 2016 | 43.3 |
| 2017 | 42.8 |
| 2018 | 42.6 |
| 2019 | 43.1 |
| 2020 | 41.5 |
| Average hours worked per week, 2014-18 | 42.8 |
| Average hours worked per week, 2019-20 | 42.3 |
Source: National Agricultural Statistics Service, "Annual Average Number of Hired Workers, Gross Wage, and Base Hours Worked – Regions and United States," Farm Labor survey reports, reports from years 2014-2020.
A caveat about the USDA data is that the averages reported for hours worked do not provide enough context about the wide variation in hours worked by farmworkers, in terms of individual crops or commodities, and especially during peak harvest times. In addition, the USDA data also exclude workers employed by farm labor contractors and other crop support businesses that bring workers to farms. But the consistency in the average hours worked at least provides a baseline of information showing that there have been no major shifts in terms of average weekly hours worked in California.
2. Total wages paid by agricultural employers to farmworkers in California increased more slowly after passage of California’s agricultural overtime law
Data from the Quarterly Census of Employment and Wages (QCEW) from the Bureau of Labor Statistics shows that in California—contrary to what agribusiness representatives are warning will happen in Massachusetts—wages have not increased at a rapid or extraordinary rate since the implementation of the phased-in overtime law in California. In fact, the total amount of wages paid by agricultural employers has grown at a slower rate in nominal terms than in the immediately preceding years. Table 2 below shows the total wages paid by private agricultural employers in California under the North American Industry Classification System (NAICS) code 11, for Agriculture, forestry, fishing and hunting, between 2014 and 2020.
Total wages paid by agricultural employers in California grew more slowly after state overtime law implemented: Total wages paid by agricultural employers in California (in thousands), 2014-20
| Year | Annual wages |
|---|---|
| 2014 | $11,944,321 |
| 2015 | $12,757,819 |
| 2016 | $13,699,376 |
| 2017 | $14,043,817 |
| 2018 | $14,611,339 |
| 2019 | $15,326,536 |
| Average annual increase in total wages paid, 2014–18 | 5.5% |
| Average annual increase in total wages paid, 2018–20 | 4.9% |
Note: All values in nominal terms.
Source: Quarterly Census of Employment and Wages, Total Wages (in thousands) in Private NAICS 11 Agriculture, forestry, fishing and hunting for All establishment sizes in California -- Statewide, NSA. Series ID: ENU0600030511.
According to QCEW data, in the five years leading up to beginning of the overtime phase-in period required by AB 1066 (2014-18), wages increased in nominal terms by an average of 5.5% per year. When considering the year immediately before AB 1066’s overtime provisions went into effect (2018) through the second full year of AB 1066’s overtime phase-in (2020), wages increased on average by 4.9%.
3. The number of agricultural establishments in California remained constant after AB 1066’s overtime provisions took effect
According to QCEW data, the number of agricultural establishments in California has remained constant over the past decade. Agribusiness representatives may claim that agricultural establishments in Massachusetts will be forced to close because of higher labor costs associated with farmworkers being entitled to overtime pay. But in California, enactment of AB 1066 and the overtime phase in period which began in 2019 has not correlated with a decline in agricultural establishments.
Table 3 shows that the number of agricultural establishments in 2020 was 16,840, which is 168 more establishments than in 2011. The number of agricultural establishments in 2018—the year before AB 1066’s overtime provisions took effect—was 16,812. In 2020, after the second year of AB 1066’s overtime phase-in, the number of agricultural establishments in California had increased to 16,840, an increase of 28 establishments.
Number of agricultural establishments in California held steady since implementation of state overtime law
| Year | Number of agricultural establishments |
|---|---|
| 2011 | 16,672 |
| 2012 | 16,516 |
| 2013 | 16,500 |
| 2014 | 16,610 |
| 2015 | 16,408 |
| 2016 | 16,150 |
| 2017 | 16,252 |
| 2018 | 16,812 |
| 2019 | 16,866 |
| 2020 | 16,840 |
Note: Annual average as reported by QCEW.
Source: Quarterly Census of Employment and Wages, Number of Establishments in Private NAICS 11 Agriculture, forestry, fishing and hunting for All establishment sizes in California -- Statewide, NSA. Series ID: ENU0600020511.
Farmworker wages are so low that eliminating the agricultural sub-minimum wage for farmworkers would cost very little, even if consumers covered the entire cost of it
Massachusetts currently has a sub-minimum wage for agriculture, which allows employers to pay farmworkers just $8.00 per hour, which is 40% below the Massachusetts minimum wage of $13.50, which is guaranteed by state law to most workers in the state. The Fairness for Farmworkers Act would allow farmworkers to become eligible for the normal state minimum wage of $13.50, thereby increasing the minimum hourly wage paid to farmworkers by 40%. As EPI has shown before, the wages of farmworkers are so low that raising them significantly nationwide—even by 40%—would only cost roughly the price of a large pizza, or two movie tickets, even if the entirety of the added labor cost were passed on to consumers.9
Data from the U.S. Department of Agriculture’s Economic Research Service10 show that, on average, farmers receive less than 20% of every retail dollar spent on food, but a slightly higher share of what consumers spend for fresh fruits and vegetables. Between 2000 and 2015, farmers received an average 30% of the average retail price of fresh fruits and 26% of the average retail price of fresh vegetables (2015 is the most recent year for which data are available). This means that average consumer expenditures on these items include $173 a year for farmers (0.30 x 320 = $96 + 0.26 x 295 = $77).
According to studies published by the University of California, Davis,11 farm labor costs are about a third of farm revenue for fresh fruits and vegetables, meaning that farmworker wages and benefits for fresh fruits and vegetables cost the average household $57 per year (0.33 x $173 = $57). (However, in reality, farm labor costs are less than $57 per year per household because over half of the fresh fruits and one-third of fresh vegetables purchased in the United States are imported.)
To illustrate, that means that farm owners and farmworkers together receive only about one-third of retail spending on fruits and vegetables even though most, and in some cases all, of the work it takes to prepare fresh fruits and vegetables for retail sale takes place on farms (the exact share of the price farmers receive varies slightly by crop).12 For example, strawberries are picked directly into the containers in which they are sold, and iceberg lettuce is wrapped in the field. Consumers who pay $3 for a pound of strawberries are paying about $1 to the farmer, who pays one-third of that amount to farmworkers, 33 cents. For one pound of iceberg lettuce, which costs about $1.20 on average, farmers receive 40 cents and farmworkers get 13 of those 40 cents.
So, what would it cost to raise the wages of farmworkers? One of the few big wage increases for farmworkers occurred after the Bracero guestworker program ended in 1964. Under the rules of the program, Mexican Braceros were guaranteed a minimum wage of $1.40 an hour at a time when U.S. farmworkers were not covered by the minimum wage. Some farmworkers who picked table grapes were paid $1.40 an hour while working alongside Braceros in 1964, and then were offered $1.25 in 1965, prompting a strike. César Chávez became the leader of the strike and won a 40% wage increase in the first United Farm Workers table grape contract in 1966, raising grape workers’ wages to $1.75 an hour.
What would happen if there were a similar 40% wage increase today for farmworkers nationwide and the entire wage increase were passed on to consumers? The average hourly earnings of U.S. field and livestock workers were $14 an hour in 2019;13 a 40% increase would raise their wages to $19.60 an hour.
For a typical household or consumer unit, a 40% increase in farm labor costs translates into a 4% increase in the retail price of fresh fruits and vegetables (0.30 farm share of retail prices x 0.33 farm labor share of farm revenue = 10%; if farm labor costs rise 40%, retail spending rises 4%). If average farmworker earnings rose by 40%, and the increase were passed on entirely to consumers, average spending on fresh fruits and vegetables for a typical household would rise by $25 per year (4% of $615 = $24.60).
As a result, raising wages for farmworkers by 40% could improve the quality of life for farmworkers without significantly increasing household spending on fruits and vegetables. It should be noted that if there were productivity improvements as farmers responded to higher labor costs, households could pay even less than the additional $25 per year for fresh fruits and vegetables. And in addition, considering the low wages paid to farmworkers in Massachusetts as compared to the higher nationwide wages used in EPI’s estimate, it will likely cost even less to eliminate the Massachusetts agricultural sub-minimum wage.
There exists the possibility that market and supply chain dynamics may make it difficult for farm employers to charge more for what they produce on their own, requiring other actors like distributors and grocery stores to raise prices in tandem with farmers. Other options exist as well: for example, the Massachusetts legislature could consider imposing a new, modest tax that would raise enough revenue to cover the cost of raising wages for the state’s farmworkers.
In any case, even if eliminating the subminimum wage for farmworkers in Massachusetts increases labor costs slightly for employers, these data suggest it would not be by a significant amount, whether employers cover the entire cost of higher pay or if the costs are passed entirely on to consumers—or some combination of both, or even if other options are explored.
The number of H-2A jobs certified in California has increased rapidly during the AB 1066 overtime phase-in period
Agribusiness representatives may claim that requiring employers to pay overtime to farmworkers will increase farmworker wages to such a high level that employers will end up being priced out of being able to afford paying time and half to H-2A farmworkers earning the Adverse Effect Wage Rate (AWER), the minimum wage that H-2A farmworkers must be paid. The AEWR devised by the U.S. Department of Labor (DOL), using USDA survey data from the Farm Labor Survey reports, reflects local market conditions, and is intended to ensure that H-2A farmworkers are not underpaid according to local wage standards, and that U.S. farmworkers are paid fairly.14 The current AEWR wage for H-2A farmworkers in California is $16.05 per hour, while the AEWR wage in Massachusetts is $14.99 per hour.
Table 4 shows that in 2018, the year immediately preceding the overtime phase-in period mandated by AB 1066, the number of H-2A jobs certified for employment in California by DOL stood at 18,908. By September 30, 2021—the end of the government’s 2021 fiscal year, and nearly three full years after the AB 1066 overtime phase-in had begun—the number of H-2A jobs certified had increased to 32,333. In percentage terms, that means that H-2A jobs increased in California by 71% during the period in which California farmworkers have been eligible for overtime pay. This rapid increase occurred despite California having one of the highest AEWRs in the United States, at $16.05 per hour. (Only Washington and Oregon currently require payment of a higher AEWR, at $16.34 per hour.) Clearly, given this increase in use of the H-2A program in California, neither having a relatively higher AEWR than other states nor AB 1066’s overtime pay requirement, nor any other factors, have deterred California agricultural employers from using the H-2A program to hire temporary migrant farmworkers in record numbers.
Number of H-2A jobs certified in California increased by 71% during state overtime law phase-in period
| Year | H-2A jobs certified |
|---|---|
| 2018 | 18,908 |
| 2019 | 23,321 |
| 2020 | 25,453 |
| 2021 | 32,333 |
| Increase in California H-2A jobs certified, 2018-21 | 71% |
Source: Office of Foreign Labor Certification, "H-2A Temporary Agricultural Labor Certification Program - Selected Statistics," fiscal years 2018-21, Employment and Training Administration, U.S. Department of Labor.
Conclusion: Massachusetts should provide equal rights to farmworkers by making them eligible for overtime pay and eliminating the sub-minimum wage for farmworkers
The historical injustices that have intentionally excluded farmworkers from basic worker protections and prevented them from being treated and paid fairly—on par with workers in other industries—is a stain on America’s history, one that continues to endure despite mountains of evidence proving that they are unjustified and irrational. The Massachusetts legislature has an opportunity to right two key elements of these wrongs, by making farmworkers eligible for overtime pay under state law and eliminating the agricultural sub-minimum wage.
Endnotes
1. Elise Gould and Heidi Shierholz, “Not everybody can work from home: Black and Hispanic workers are much less likely to be able to telework,” Working Economics blog (Economic Policy Institute), https://epi86dev.wpengine.com/blog/black-and-hispanic-workers-are-much-less-likely-to-be-able-to-work-from-home/.
2. U.S. Bureau of Labor Statistics, “Table 1. Incidence rates of nonfatal occupational injuries and illnesses by industry and case types, 2019,” in Injuries, Illnesses, and Fatalities, U.S. Department of Labor, https://www.bls.gov/iif/oshwc/osh/os/summ1_00_2019.htm.
3. Daniel Costa, Philip Martin, and Zachariah Rutledge, Federal labor standards enforcement in agriculture: Data reveal the biggest violators and raise new questions about how to improve and target efforts to protect farmworkers, Economic Policy Institute, December 15, 2020, https://epi.org/213135.
4. See for example, David Cooper and Teresa Kroeger, Employers steal billions from workers’ paychecks each year
Survey data show millions of workers are paid less than the minimum wage, at significant cost to taxpayers and state economies, Economic Policy Institute, May 10, 2017, https://epi86dev.wpengine.com/publication/employers-steal-billions-from-workers-paychecks-each-year/; Annette Bernhardt, Ruth Milkman, et al., Broken Laws, Unprotected Workers: Violations of Employment and Labor Laws in America’s Cities, Center for Urban Economic Development, National Employment Law Project, and UCLA Institute for Research on Labor and Employment, 2009, https://www.nelp.org/wp-content/uploads/2015/03/BrokenLawsReport2009.pdf; Centro de los Derechos del Migrante, Ripe for Reform: Abuses of Agricultural Workers in the H-2A Visa Program, April 2020, https://cdmigrante.org/wp-content/uploads/2020/04/Ripe-for-Reform.pdf.
5. See for example, Mary Bauer and Meredith Stewart, Close to Slavery: Guestworker Programs in the United States, Southern Poverty Law Center, February 19, 2013, https://www.splcenter.org/20130218/close-slavery-guestworker-programs-united-states.
6. Daniel Costa, “The farmworker wage gap continued in 2020: Farmworkers and H-2A workers earned very low wages during the pandemic, even compared with other low-wage workers,” Working Economics blog (Economic Policy Institute), https://epi.org/232757. For previous years comparing farmworkers with production and nonsupervisory nonfarm workers
7. AB-1066, Agricultural workers: wages, hours, and working conditions (2015-2016). From California Legislative Information website.
8. National Agricultural Statistics Service, Farm Labor survey reports, U.S. Department of Agriculture (various quarters).
9. Daniel Costa and Philip Martin, “How much would it cost consumers to give farmworkers a significant raise? A 40% increase in pay would cost just $25 per household,” Working Economics blog (Economic Policy Institute), October 15, 2020.
10. Economic Research Service, “Price Spreads from Farm to Consumer,” U.S. Department of Agriculture.
11. See, U.C. Davis cost studies series, published by the Agricultural and Resource Economics Department.
12. Economic Research Service, “Price Spreads from Farm to Consumer,” U.S. Department of Agriculture.
13. National Agricultural Statistics Service, Farm Labor survey report, U.S. Department of Agriculture, November 21, 2019.
14. See, Employment and Training Administration, Adverse Effect Wage Rates, U.S. Department of Labor, 2021.
