Dear Members McDuffie, Hughes, and Fisher:
I am writing to provide you testimony in your capacity as Members of the Farm Laborers Wage Board (hereinafter “Wage Board”), which is now considering whether to lower the current overtime pay threshold of 60 hours per week for farmworkers employed in New York, and I urge the Wage Board to lower the overtime threshold to 40 hours per week. Although the 60 hour per week threshold in New York is an improvement on the federal overtime law which exempts farmworkers from being entitled to any overtime pay, regardless of hours worked in a day or a week, the 60-hour threshold still falls far short of the overtime pay that most workers are entitled to in other industries, which is time and a half after 8 hours worked in a day or 40 hours worked in a week.
I have researched and written about farm labor issues, including wages, labor standards, and worksite enforcement, for over 11 years at the Economic Policy Institute (EPI). Some of my past reports are included in the footnotes of this testimony. I am also a Visiting Scholar with the Global Migration Center at the University of California, Davis—a university located in California’s agricultural heartland, the Central Valley.
Despite numerous claims being made by agribusiness representatives that a more reasonable threshold of hours for overtime pay for farmworkers will negatively impact the agricultural industry, there is virtually no credible evidence to support such claims, and certainly no “smoking gun” evidence suggesting that overtime pay for farmworkers after 40 hours per week will hurt the industry or slash profits dramatically. In fact, the limited available evidence that does exist regarding the impact of overtime pay on the agricultural industry in the nation’s biggest and most important farm state, California—strongly suggests that is not the case, and perhaps even the opposite may be true. In other words, data on agricultural employment and wages in California suggest that overtime pay for farmworkers has not corresponded with any negative impacts or shocks to the California farm economy or labor market.
In fact, the implementation of California’s overtime pay law has even corresponded with a small increase in the number of agricultural establishments, slower growth in the total wages paid to workers than in previous years, and a sharp increase in the employment of temporary migrant farmworkers through the H-2A visa program—a terribly flawed and problematic visa program—but I note this fact because in California, many of the H-2A workers are entitled to overtime pay depending on the size of farm they work on, and that has not deterred employers from utilizing the program. This testimony will present some of the relevant information about these realities, which suggests that overtime pay for farmworkers in New York after 40 hours per week will not lead to the negative outcomes that agribusiness representatives appear to be claiming will result—largely without evidence.
Farmworkers are a precarious workforce, with few rights or access to justice
The coronavirus pandemic and the ensuing economic collapse was a difficult time for many workers and families, with hundreds of thousands of deaths and widespread human suffering. While millions of workers were allowed to remain home and work remotely in order to stay safe, the vast majority of workers did not have a remote work option, either because employers did not permit it or because it was simply not feasible.1 One key segment of the workforce that was expected to keep working in order to sustain the food supply chain—but at great risk to themselves and their families—were farmworkers.
Even before the pandemic, farmworkers were employed in one of the most hazardous jobs in the entire U.S. labor market,2 and as EPI research has shown, they suffer very high rates of wage and hour violations.3 While the number of wage and hour inspections by the U.S. Department of Labor has recently dropped to the lowest levels ever, at about 100 inspections per month in agriculture, the vast majority of those investigations—70%–detect violations. The low number of inspections means that there’s only about a 1% chance that any agricultural employer in the United States will ever be investigated in a given year, and may therefore reasonably assume that they can violate wage and hour laws with impunity. 4 As a result, it is even more important to have robust labor standards in place to ensure farmworkers are paid fairly.
In addition, most farmworkers in the United States either lack an immigration status or are employed via a precarious, temporary status through the H-2A visa program. The lack of an immigration status, or having only a temporary status, means that unauthorized and H-2A farmworkers are even worse off because they have limited labor rights, which increases their vulnerability to wage theft and other abuses.5
Unauthorized immigrants who speak up about unfair treatment or abuse in the workplace risk employer retaliation in the form of deportation. In the case of temporary migrant farmworkers employed though the H-2A visa program, H-2A workers are not permitted to change employers and are thus practically indentured to them.6 The half of farmworkers who are unauthorized plus 10% of farmworkers with H-2A visas mean that only 40% of the farm workforce are U.S. citizens and legal immigrants with full rights and agency in the labor market. Having the majority of the farm workforce employed without basic workplace rights in turn puts downward pressure on labor standards for all workers and has helped to keep wages low in agriculture for decades.
Farmworkers provide an essential service but are vastly underpaid
As EPI research has also demonstrated, farmworkers are among the lowest-paid workers in the entire U.S. workforce, even lower than other comparable low-wage workers. As Figure A below shows, farmworkers earned just $14.62 per hour on average in 2020, which is just 60%—or three fifths—of what production and nonsupervisory nonfarm workers earned ($24.67), who are the most appropriate cohort of workers outside of agriculture to compare with farmworkers.7
The farmworker wage gap in 2020: Farmworkers earn very low wages compared with other workers: Average hourly wage rate for farmworkers and H-2A workers compared with average hourly wages of other workers, 2020
| Type | Amount | |
|---|---|---|
| H-2A farmworkers | $13.68 | |
| Nonsupervisory farmworkers | $14.62 | |
| Workers with less than HS | $15.06 | |
| Workers with HS diploma only | $20.09 | |
| Nonsupervisory nonfarm | $24.67 | |
| All workers | $28.78 | |
Notes: All values are for 2020 and in 2020 dollars. HS = high school. H-2A wage is the national average Adverse Effect Wage Rate for 2020, as reported by the U.S. Department of Labor, and does not reflect the average wage paid to the H-2A workers who were ultimately employed in 2020. Nonsupervisory nonfarm workers’ wage represents the average hourly earnings of production and nonsupervisory employees, total for the private sector, not seasonally adjusted. Nonsupervisory farmworkers’ wage is the gross average hourly wage of field and livestock workers. Data for all workers, and for workers with a high school diploma and less than high school, can be found at the Economic Policy Institute State of Working America Data Library. The H-2A visa program is described by the U.S. Department of Labor as a "temporary agricultural program [that] allows agricultural employers who anticipate a shortage of domestic workers to bring nonimmigrant foreign workers to the U.S. to perform agricultural labor or services of a temporary or seasonal nature."
Sources: Author’s analysis of USDA Farm Labor Survey data and nonfarm wage data from the BLS Current Employment Statistics survey; EPI analysis of CPI-ORG microdata; Office of Foreign Labor Certification historical state AEWRs
Author’s analysis of USDA, Economic Research Service using data from National Agricultural Statistics Service, Farm Labor Survey, and nonfarm wage data are from Bureau of Labor Statistics, Current Employment Statistics survey; EPI analysis of Current Population Survey Outgoing Rotation Group microdata (Economic Policy Institute, State of Working America Data Library); Office of Foreign Labor Certification, “Historical State AEWRs: Adverse Effect Wage Rate by State from 2014 to Present,” U.S. Department of Labor.
Farmworkers have very low levels of educational attainment, and compared to the two groups of workers with the lowest levels of education in the United States, farmworkers earn even less on average: Figure A also shows that nonsupervisory farmworkers at $14.62 per hour earned 44 cents per hour less than the average wage earned by all workers without a high school diploma ($15.06), and farmworkers earned roughly $5 less per hour than the average wage earned by all workers with only a high school diploma ($20.09).
Many farmworkers employed through the H-2A visas program fared even worse in 2020. Figure A shows that the wage paid to most farmworkers with H-2A visas—known as the Adverse Effect Wage Rate (AEWR)—was even lower, with a national average of $13.68 per hour, according to the U.S. Department of Labor. But many H-2A farmworkers earned far less in some of the biggest H-2A states. In Florida and Georgia—where a quarter of all H-2A jobs were located in 2020—H-2A workers were paid the lowest state AEWR, at $11.71 per hour.
These data prove that the claim which is often made and repeated by farm employers and agribusiness lobbyists and representatives—i.e., that wages are rising too quickly for farmworkers and that the AEWR for H-2A workers is too high and rising too quickly, and thus not consistent with labor market trends—is not credible and not based on any data or evidence.
Overtime protections for farmworkers in California: Current law requires overtime pay after 8 hours per day or 40 hours per week for farms with 26 or more employees
California’s Assembly Bill (AB) 1066 (2016) created a timetable for workers employed in agriculture to receive overtime pay on the same basis as workers in most other industries—in other words, time and a half after 8 hours per day or 40 hours per week—but AB 1066 created a specified phase-in period so that employers could have time to adjust to the new rules. The law specifies that farmworkers employed on farms with 26 or more employees would gradually receive overtime pay between 2019 and 2022, based on a declining threshold of hours worked, eventually requiring time and a half after 8 hours per day or 40 hours per week in the fourth year after the phase-in period begins. Farms with 25 or fewer employees are subject to a delayed phase-in period, beginning on January 1, 2022 and ending on January 1, 2025 (meaning all employers of all sizes must pay time and a half after 8 hours per day or 40 hours per week beginning on January 1, 2025).
The preamble to AB 1066 summarizes the updated overtime rule for farmworkers:
This bill would remove the exemption for agricultural employees regarding hours, meal breaks, and other working conditions, including specified wage requirements, and would create a schedule that would phase in overtime requirements for agricultural workers, as defined, over the course of 4 years, from 2019 to 2022, inclusive. Beginning January 1, 2022, the bill would require any work performed by a person, employed in an agricultural occupation, in excess of 12 hours in one day to be compensated at the rate of no less than twice the employee’s regular rate of pay. The bill would provide employers who employ 25 or fewer employees an additional 3 years to comply with the phasing in of these overtime requirements.8
The hours worked per day or per week before farmworkers are eligible for overtime pay, i.e. at a rate of one and one-half times the employee’s regular rate of pay, is phasing-in according to the schedule shown in Figure B, which comes from the Labor Commissioner’s Office in the California Department of Industrial relations.
Overtime for California farmworkers on farms with 26 or more employees was phased-in between 2019 and 2022: Smaller farms phased-in between 2022 and 2025
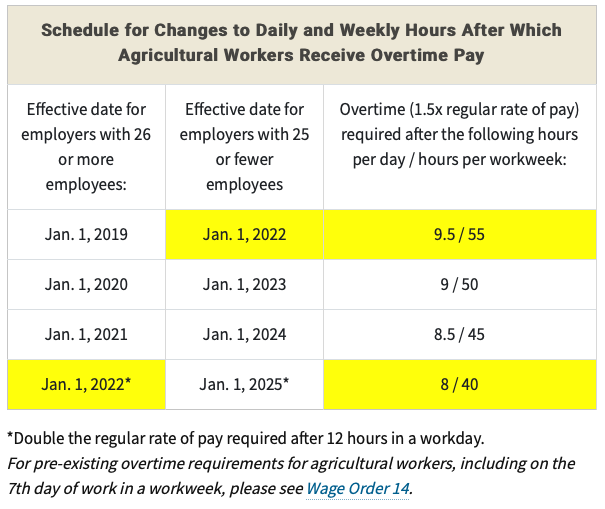
Notes: The image in this figure is a copy of the original, created by the California Department of Industrial Relations (see Source).
Source: Labor Commissioner's Office, "Overtime for Agricultural Workers," California Department of Industrial Relations, January 2022.
For nearly three years, farmworkers employed on farms with 26 or more employees in California have been entitled to overtime pay. On January 1, 2022, those workers became entitled to overtime pay on par with the overtime threshold in other industries, after 8 hours per day or 40 per week. In addition, as shown in Figure B, on that date, those same farmworkers who work more than 12 hours in one day must be paid twice the amount of their regular rate of pay.
The phase-in period for farm employers with 25 or fewer employees began on January 1, 2022, and now requires those employers to pay time and a half overtime to farmworkers who work more than 9.5 hours in a day or 55 hours in a week.
Due to gaps in available public data, it is impossible to know the share of employers in California who are now required to pay the full overtime rate of 8 hours per day or 40 hours per week. Data from the Quarterly Census of Employment and Wages (QCEW) from the Bureau of Labor Statistics, as well as the Farm Labor Survey (FLS) from the U.S. Department of Agriculture (USDA), provide statistics on the number of agricultural establishments by number of employees, but only at the national level. The Census of Agriculture (COA) from 2017 is somewhat outdated now, but nevertheless contains one table listing the number of farms by number of hired workers. However, the largest denomination of workers in the COA data is 10, making it impossible to know how many farms hire 25 or fewer workers or 26 or more workers, the employee threshold set in the AB 1066.9
National-level data from the FLS and QCEW suggest that anywhere between one-third and half of farms in the United States employ 26 or more workers.10 If we apply those shares to California, and assume that one-third to one-half of California’s farms employ 26 or more workers, that means that somewhere between 5,600 to 8,500 of California’s roughly 17,000 farms11 have been required to pay overtime since 2019 and are now paying their employees time and a half after they have worked 8 hours per day or 40 hours per week.
California’s farm economy and labor market indicators have held steady since implementation of the state requirement that farmworkers be paid overtime
While there is limited available evidence regarding the impact of overtime pay in agriculture, basic data on the agricultural economy in the nation’s biggest and most important farm state—California—strongly suggests that overtime pay for farmworkers has not corresponded with any negative impacts or shocks to the California farm economy or labor market. This section discusses four key indicators, and briefly responds to some of the claims made in a recent study by Christopher Wolf, Rich Stup, and Jason Karszes of Cornell University,12 which are based on the opinions of self-interested employers, as well as on a survey of temporary migrant workers with H-2A visas that asked questions to H-2A workers that were inconsistent with how the H-2A program operates in practice.
- Average hours worked by farmworkers in California have remained constant during the overtime phase-in period
The U.S. Department of Agriculture’s (USDA) Farm Labor Survey (FLS)13 provides an important source of information on wages paid to U.S. farmworkers and hours worked by them. Data published by USDA on the average of hours worked per week by farmworkers on California farms—before and after enactment and implementation of the AB 1066 farmworker overtime law—shows that the number of hours worked remained relatively constant, dropping on average by less than one hour.
Table 1 shows that between 2014 and 2018, the five years preceding the overtime phase-in period mandated by AB 1066, California’s farmworkers worked an average of 42.8 hours per week. In the three years that AB 1066’s overtime provisions have been in effect, farmworkers worked an average of 41.9 hours per week, less than one hour difference from the preceding five years.
Thus, in the five years before AB 1066’s phased-in overtime provisions went into effect, as well as during the three years of 2019 to 2021, when the phased-in overtime law was in effect, hours worked have remained relatively steady, suggesting that California’s overtime pay requirement has not correlated with a drastic change in the number of hours worked by California’s farmworkers.
USDA survey data shows average weekly work hours for California farmworkers remained relatively constant after implementation of state overtime law
| Year | Hours worked per week |
|---|---|
| 2014 | 42.8 |
| 2015 | 42.7 |
| 2016 | 43.3 |
| 2017 | 42.8 |
| 2018 | 42.6 |
| 2019 | 43.1 |
| 2020 | 41.5 |
| 2020 | 41.5 |
| 2021 | 41.3 |
| Average hours worked per week, 2014-18 | 42.8 |
| Average hours worked per week, 2019-21 | 41.9 |
Source: National Agricultural Statistics Service, "Annual Average Number of Hired Workers, Gross Wage, and Base Hours Worked – Regions and United States," Farm Labor survey reports, reports from years 2014-2020.
A caveat about the USDA data is that the averages reported for hours worked do not provide enough context about the wide variation in hours worked by farmworkers, in terms of individual crops or commodities, and especially during peak harvest times. In addition, the USDA data also exclude workers employed by farm labor contractors and other crop support businesses that bring workers to farms. But the consistency in the average hours worked at least provides a baseline of information showing that there have been no major shifts in terms of average weekly hours worked in California.
- Total wages paid by agricultural employers to farmworkers in California increased more slowly after passage of California’s agricultural overtime law
Data from QCEW from the Bureau of Labor Statistics shows that in California—contrary to what agribusiness representatives may claim will happen in New York—total wages paid by employers have not increased at a rapid or extraordinary rate since the implementation of the phased-in overtime law in California. In fact, the total amount of wages paid by agricultural employers has grown at a slower rate in nominal terms than in the immediately preceding years. Table 2 below shows the total wages paid by private agricultural employers in California under the North American Industry Classification System (NAICS) code 11 for Agriculture, between 2014 and 2020.
Total wages paid by agricultural employers in California grew more slowly after state overtime law implemented: Total wages paid by agricultural employers in California (in thousands), 2014-20
| Year | Annual wages |
|---|---|
| 2014 | $11,944,321 |
| 2015 | $12,757,819 |
| 2016 | $13,699,376 |
| 2017 | $14,043,817 |
| 2018 | $14,611,339 |
| 2019 | $15,326,536 |
| Average annual increase in total wages paid, 2014–18 | 5.5% |
| Average annual increase in total wages paid, 2018–20 | 4.9% |
Note: All values in nominal terms.
Source: Quarterly Census of Employment and Wages, Total Wages (in thousands) in Private NAICS 11 Agriculture, forestry, fishing and hunting for All establishment sizes in California -- Statewide, NSA. Series ID: ENU0600030511.
According to QCEW data, in the five years leading up to beginning of the overtime phase-in period required by AB 1066 (2014-18), total wages paid increased in nominal terms by an average of 5.5% per year. When considering the year immediately before AB 1066’s overtime provisions went into effect (2018) through the second full year of AB 1066’s overtime phase-in (2020), wages increased on average by 4.9%.
- The number of agricultural establishments in California remained constant after AB 1066’s overtime provisions took effect
According to QCEW data, the number of agricultural establishments in California has remained constant over the past decade. Agribusiness representatives may claim that agricultural establishments in New York will be forced to close or will decide to move their operations to other U.S. states because of higher labor costs associated with farmworkers being entitled to overtime pay. In fact, Wolf, Stup, and Karszes make almost this exact claim after surveying and speaking with agricultural employers in New York, concluding that “a 40-hour threshold would prompt farmers to curtail investments in New York agriculture, and lead some to invest in other states.”14 But in California, this has not been the case: enactment of AB 1066 and the overtime phase in period which began in 2019 has not correlated with a decline in agricultural establishments.
Table 3 shows that the number of agricultural establishments in 2020 was 16,840, which is 168 more establishments than in 2011. The number of agricultural establishments in 2018—the year before AB 1066’s overtime provisions took effect—was 16,812. In 2020, after the second year of AB 1066’s overtime phase-in, the number of agricultural establishments in California had increased to 16,840, an increase of 28 establishments. While there was a small drop in the number of establishments between 2019 and 2020, of 26 establishments, preliminary data from the QCEW also show that in the second quarter of 2021, the number of agricultural establishments in California increased by a few hundred, and stood at 17,088.15
Number of agricultural establishments in California held steady since passage and implementation of state overtime law
| Year | Number of agricultural establishments |
|---|---|
| 2011 | 16,672 |
| 2012 | 16,516 |
| 2013 | 16,500 |
| 2014 | 16,610 |
| 2015 | 16,408 |
| 2016 | 16,150 |
| 2017 | 16,252 |
| 2018 | 16,812 |
| 2019 | 16,866 |
| 2020 | 16,840 |
| 2021 (Q2) | 17,088 |
Note: Annual average as reported by QCEW. Data for 2021 are preliminary and only for the second quarter of 2022 (Q2).
Source: Quarterly Census of Employment and Wages, Number of Establishments in Private NAICS 11 Agriculture, forestry, fishing and hunting for All establishment sizes in California -- Statewide, NSA. Series ID: ENU0600020511.
- The number of H-2A jobs certified in California has not declined during the AB 1066 overtime phase-in period, but instead has increased rapidly
As alluded to earlier in this testimony, the H-2A program is a deeply flawed program that is in desperate need of reform because it relegates migrant farmworkers to an indentured status, where they have no ability to change employers, leaving them with few workplace rights in practice. Nevertheless, agribusiness representatives who utilize the program may claim that requiring employers to pay overtime to H-2A farmworkers will increase wages to such a high level that employers will end up being priced out of being able to afford paying time and half to H-2A farmworkers earning the Adverse Effect Wage Rate (AWER), the minimum wage that H-2A farmworkers must be paid. There is no evidence from California to suggest that this would occur.
The AEWR devised by the U.S. Department of Labor (DOL), using USDA survey data from the Farm Labor Survey reports, reflects local market conditions, and is intended to ensure that H-2A farmworkers are not underpaid according to local wage standards, and that U.S. farmworkers are paid fairly.16 The current AEWR wage for H-2A farmworkers in California is $17.51 per hour, while the AEWR wage in New York is $15.66 per hour.
The number of H-2A jobs certified and visas issued in the United States has increased dramatically since 2013, tripling in that time, and the number of H-2A jobs certified in California has also increased as part of that broader national trend. However, the growth in California has been even more rapid, eventually moving California into one of the top five states for H-2A employment during that period.17 Focusing on H-2A program in just the years since passage of AB 1066, Table 4 shows that in 2018, the year immediately preceding the overtime phase-in period mandated by AB 1066, the number of H-2A jobs certified for employment in California by DOL stood at 18,908. By September 30, 2021—the end of the government’s 2021 fiscal year, and nearly three full years after the AB 1066 overtime phase-in had begun—the number of H-2A jobs certified had increased to 32,333. In percentage terms, that means that H-2A jobs increased in California by 71% during the period in which California farmworkers employed on farms with 26 or more workers have been eligible for overtime pay during the scheduled phase-in period.
This rapid increase occurred despite California having one of the highest AEWRs in the United States in previous years, and now the highest AEWR as of December 29, 2021.18 Clearly, given this sharp increase in use of the H-2A program in California since 2019—the implementation of AB 1066’s overtime pay requirement does not appear to have deterred California agricultural employers from using the H-2A program to hire temporary migrant farmworkers—instead, they have hired H-2A workers in record numbers.
Number of H-2A jobs certified in California increased by 71% during state overtime law phase-in period
| Year | H-2A jobs certified |
|---|---|
| 2018 | 18,908 |
| 2019 | 23,321 |
| 2020 | 25,453 |
| 2021 | 32,333 |
| Increase in California H-2A jobs certified, 2018-21 | 71% |
Source: Office of Foreign Labor Certification, "H-2A Temporary Agricultural Labor Certification Program - Selected Statistics," fiscal years 2018-21, Employment and Training Administration, U.S. Department of Labor.
A brief note about the Wolf, Stup, and Karszes survey of H-2A workers: One claim about the H-2A program that is likely to be made in written or oral format before this board by Wolf, Stup, and Karszes, based on their study, merits being specifically addressed. They note in their conclusion that “if managers cap hours in response to lower overtime thresholds, the ability to attract H-2A workers is a concern,” a conclusion they justify based on their survey of H-2A workers.19 (Although it should be noted that employers are not required to cap hours in response to a lower overtime threshold.)
That overarching claim, as well as the questions asked to H-2A workers in their survey, are difficult to reconcile with the reality of how the H-2A program operates. For example, their survey asked H-2A workers “about why they came to work at this farm,” meaning the particular farm they work on, and documented answers such as “good management,” “hours available,” and “location.” But the reality of the H-2A program is that it has an employer-driven administrative process, where the employer applies for a worker to the U.S. Department of Labor and then to United States Citizenship and Immigration Services in the Department of Homeland Security, and ultimately to the U.S. Department of State. As a result of this, for all intents and purposes, the employer owns and controls the H-2A worker’s visa status, which is tied to the particular job the employer is offering the worker.
On the worker side, prospective H-2A workers in their countries of origin are usually contracted through a labor recruiter (which can be an individual or firm) who is either seeking workers on behalf of the employer or on behalf of another recruiter (or recruiters) who has contracted with the ultimate employer to find H-2A workers to hire. The workers then appear at a U.S. consulate in their home country to be interviewed for a visa that the U.S. employer has applied for on the worker’s behalf. As a result, migrant workers have very little choice in the matter, in terms of which H-2A jobs are available to them in the United States—including which job terms are on offer or where the job is located.
This reality of this entire process is well-known and has been documented in numerous reports, including government audits, and is the subject of justified criticism from advocacy groups because migrants are often charged illegal fees, leaving them in debt, and have been the victims of fraud and even human trafficking as a result of the H-2A the recruitment process.20
Wolf, Stup, and Karszes also asked H-2A workers “If work hours were not capped (limited) in other U.S. states, while they were in New York, would you consider going to that state instead of New York for work?” and cite that “70% of respondents indicated that they would consider going to a state without limits on weekly hours.” This survey question and answer—which appears intended to lead the Wage Board to believe that H-2A workers will leave New York farms in droves for opportunities in other states—reveals that the authors do not know the basics about how the H-2A program operates in practice, especially in terms of the rights that H-2A workers have. While it may be true that H-2A workers would “consider” going to work in another state if they had the right to change jobs, the reality of the H-2A program is that because of the program’s legal framework, H-2A workers do not have a choice in the matter because they do not have the practical ability to change jobs and find another employer to work for, whether in New York or any other state. If H-2A workers leave their current job and the employer who hired them, they will lose their visa status, and with it, the ability to remain and work in the United States. This also means losing the ability to earn back the money that was invested to come to the United States—often including payment to a labor recruiter—as well as becoming subject to being detained by immigration enforcement authorities and ultimately deported.21
Therefore, the Wage Board should view the claims made in the Wolf, Stup, and Karszes report with extreme skepticism and as being out of sync with reality, considering both the fact that the H-2A survey is flawed and misleading, and that the other respondents for the other portions of their survey are all farm employers, who are obviously not neutral actors in the matter of overtime for farmworkers—in fact, they almost universally oppose it and are actively lobbying keep the 60 hour threshold.
Conclusion: New York should provide equal rights to farmworkers by making them eligible for overtime pay after 40 hours per week
The historical injustices that have intentionally excluded farmworkers from basic worker protections and prevented them from being treated and paid fairly—on par with workers in other industries—is a stain on America’s history, one that continues to endure despite mountains of evidence proving that they are unjustified and irrational. The Farm Laborers Wage Board has an opportunity to right this wrong, by making farmworkers eligible for overtime pay after 40 hours per week rather than the current threshold of 60. I urge the board adopt a 40 hour threshold.
Thank you for your consideration,
Daniel Costa, Esq.
Director of Immigration Law and Policy Research
Economic Policy Institute
Endnotes
1. Elise Gould and Heidi Shierholz, “Not everybody can work from home: Black and Hispanic workers are much less likely to be able to telework,” Working Economics blog (Economic Policy Institute), March 19, 2020.
2. U.S. Bureau of Labor Statistics, “Table 1. Incidence rates of nonfatal occupational injuries and illnesses by industry and case types, 2019,” in Injuries, Illnesses, and Fatalities, U.S. Department of Labor.
3. Daniel Costa, Philip Martin, and Zachariah Rutledge, Federal labor standards enforcement in agriculture: Data reveal the biggest violators and raise new questions about how to improve and target efforts to protect farmworkers, Economic Policy Institute, December 15, 2020.
4. Daniel Costa, Philip Martin, and Zachariah Rutledge, Federal labor standards enforcement in agriculture: Data reveal the biggest violators and raise new questions about how to improve and target efforts to protect farmworkers, Economic Policy Institute, December 15, 2020.
5. See for example, David Cooper and Teresa Kroeger, Employers steal billions from workers’ paychecks each year
Survey data show millions of workers are paid less than the minimum wage, at significant cost to taxpayers and state economies, Economic Policy Institute, May 10, 2017,; Annette Bernhardt, Ruth Milkman, et al., Broken Laws, Unprotected Workers: Violations of Employment and Labor Laws in America’s Cities, Center for Urban Economic Development, National Employment Law Project, and UCLA Institute for Research on Labor and Employment, 2009; Centro de los Derechos del Migrante, Ripe for Reform: Abuses of Agricultural Workers in the H-2A Visa Program, April 2020.
6. See for example, Mary Bauer and Meredith Stewart, Close to Slavery: Guestworker Programs in the United States, Southern Poverty Law Center, February 19, 2013; Centro de los Derechos del Migrante, Ripe for Reform: Abuses of Agricultural Workers in the H-2A Visa Program, April 2020.
7. Daniel Costa, “The farmworker wage gap continued in 2020: Farmworkers and H-2A workers earned very low wages during the pandemic, even compared with other low-wage workers,” Working Economics blog (Economic Policy Institute), July 20, 2021. For previous years comparing farmworkers with production and nonsupervisory nonfarm workers, see Economic Research Service, “Wages of Hired Farmworkers” in “Farm Labor,” U.S. Department of Agriculture, last updated August 18, 2021.
8. AB-1066, Agricultural workers: wages, hours, and working conditions (2015-2016). From California Legislative Information website.
9. National Agricultural Statistics Service, “Table 7. Hired Farm Labor – Workers and Payroll: 2017” (listed by U.S. state), in 2017 Census of Agriculture, U.S. Department of Agriculture.
10. See Tables 1 and 2 in Daniel Costa and Philip Martin, “Nine in 10 farmworkers could be covered by the paid leave provisions of the Families First Coronavirus Response Act—but not if smaller employers are exempted,” Working Economics blog (Economic Policy Institute), citing QCEW and Farm Labor Survey data.
11. For the number of agricultural establishments in California, see Table 3 in this testimony.
12. Christopher Wolf, Rich Stup, and Jason Karszes, Effects of NY Ag Overtime Laws on Production Costs and Competitiveness: A Report to the New York Department of Agriculture and Markets, E.B 2021-06, November 2021.
13. National Agricultural Statistics Service, Farm Labor survey reports, U.S. Department of Agriculture (various quarters).
14. Christopher Wolf, Rich Stup, and Jason Karszes, Effects of NY Ag Overtime Laws on Production Costs and Competitiveness: A Report to the New York Department of Agriculture and Markets, E.B 2021-06, November 2021.
15. Quarterly Census of Employment and Wages, Number of Establishments in Private NAICS 11 Agriculture, forestry, fishing and hunting for All establishment sizes in California — Statewide, NSA. Series ID: ENU0600020511. Data cited in text for 2021 are preliminary and only for the second quarter of 2022 (Q2).
16. See, Employment and Training Administration, Adverse Effect Wage Rates, Range Occupations (effective January 1, 2022) and Non-Range Occupations (effective December 29, 2021), U.S. Department of Labor, 2022.
17. Rural Migration News, “H-2A: Growth and Reform,” University of California, Davis, December 30, 2021
18. Only Washington and Oregon currently also require payment of an AEWR above $17 per hour, at $17.41 per hour.
19. Christopher Wolf, Rich Stup, and Jason Karszes, Effects of NY Ag Overtime Laws on Production Costs and Competitiveness: A Report to the New York Department of Agriculture and Markets, E.B 2021-06, November 2021.
20. See for example, Farmworker Justice, No Way to Treat a Guest, 2011; Daniel Costa, Temporary work visa programs and the need for reform: A briefing on program frameworks, policy issues and fixes, and the impact of COVID-19, Economic Policy Institute, February 3, 2021; Centro de los Derechos del Migrante, Recruitment Revealed: Fundamental Flaws in the H-2 Temporary Worker Program and Recommendations for Change, n.d., accessed December 10, 2020; Mary Bauer and Meredith Stewart, Close to Slavery: Guestworker Programs in the United States, Southern Poverty Law Center, Feb. 19, 2013; Centro de los Derechos del Migrante, Ripe for Reform: Abuses of Agricultural Workers in the H-2A Visa Program, April 2020.
21. See for example, Daniel Costa, Temporary work visa programs and the need for reform: A briefing on program frameworks, policy issues and fixes, and the impact of COVID-19, Economic Policy Institute, February 3, 2021; Centro de los Derechos del Migrante, Recruitment Revealed: Fundamental Flaws in the H-2 Temporary Worker Program and Recommendations for Change, n.d., accessed December 10, 2020; Mary Bauer and Meredith Stewart, Close to Slavery: Guestworker Programs in the United States, Southern Poverty Law Center, Feb. 19, 2013
