Briefing Paper #376
Executive summary
The U.S. steel industry is facing its worst import crisis in more than a decade. In the aftermath of the Great Recession, steelmakers in other countries, backed by aggressive government support, continued to add production capacity as demand stagnated. The open and large U.S. market became the prime target for the massive excess supply stemming from this excess capacity, and, since 2011, U.S. steel imports have surged and import unit values have plummeted.
- Global excess steel capacity is now over half a billion metric tons, more than twice the volume of excess capacity in the last steel import crisis that followed the Asian financial crisis more than a decade ago. While China accounts for more than a third of global excess capacity, there is also significant overcapacity in South Korea, India, and elsewhere. With more additions planned overseas and a continued slow recovery in demand, the excess capacity problem is not projected to be resolved any time soon.
- Excess capacity means that steel production facilities have the capacity to produce much more steel than the market demands. High fixed costs, capital intensity, and the large scale of steelmaking encourages state-backed producers with excess capacity to maintain production in excess of domestic demand, and export the surplus at below-market rates.
- The glut of exports from global excess steel supply is targeted in particular at the U.S. market. U.S. steel imports increased from 28.5 million net tons in 2011 to 32.0 million net tons in 2013, an increase of 12.3 percent. Imports have increased not only in absolute terms, but also relative to domestic production and consumption, seizing more of the U.S. market and thwarting the domestic industry’s efforts to recover from the Great Recession.
- U.S. steel imports surged even more sharply in the first two months of 2014, hitting 6.4 million net tons, an increase of 24.5 percent over the same period in 2013. Domestic shipments declined 0.9 percent over the same period. Consequently, the import share of the domestic market increased 4.5 percentage points in January–February 2014 (an increase of 18.5 percent over the same period in 2013).
- Evidence that imported steel prices are falling, and falling unfairly, can be found in the declining sales price of imports (now underselling comparable domestic products) and the rapid growth in the number of unfair trade complaints filed in the past year. The average unit value of imported steel declined $259 per ton (23.1 percent) between 2011 and January–February 2014. U.S. steel producers filed 40 antidumping and countervailing duty petitions in 2013 and the first two months of 2014, the largest volume of trade cases in steel since 2001.
Surging imports of unfairly traded steel are threatening U.S. steel production, which supports more than a half million U.S. jobs across every state of the nation. The import surge has depressed domestic steel production and revenues, leading to sharp declines in net income in the U.S. steel industry over the past two years (2012–2013), layoffs for thousands of workers, and reduced wages for many more.
- While U.S. steel output has begun to recover from the depths of the Great Recession, domestic producers have experienced declining shipments since 2013, and sharply declining revenues since 2012. As a result, the U.S. steel industry had net losses of $388 million in 2012 and $1.2 billion in 2013, and it has now posted net losses in four of the past five years. A large, capital-intensive industry cannot long survive in its present form when subject to such chronic financial losses.
- As the domestic industry has struggled with growing unfair import competition, thousands of steel workers have lost their jobs. Since the beginning of 2012, an estimated 4,184 steel workers in eight states have been certified for Trade Adjustment Assistance because imports or shifts in production contributed to their job loss. More layoffs have been announced in recent months. Nearly 1,000 steel jobs have been lost due to surging imports in the first three months of 2014.
- U.S. steel production supported 583,600 jobs in 2012, including 123,400 direct jobs in steel production; 255,500 of the jobs supported were in manufacturing (including direct jobs in the steel industry), accounting for 43.8 percent of all jobs supported by the industry. These jobs are at risk if surging imports of unfairly traded steel are allowed to displace domestic steel production.
- The top 10 states, ranked by total number of jobs at risk from displaced domestic steel production, are Texas (59,800 jobs supported), California (52,300 jobs), Pennsylvania (35,300 jobs), Ohio (33,900 jobs), Illinois (28,400 jobs), Indiana (26,000 jobs), New York (25,100 jobs), Florida (23,200 jobs), Michigan (20,100 jobs), and Wisconsin (15,700 jobs).
These 583,600 steel-related jobs are at risk if the U.S. does not fully and effectively enforce its trade remedy laws, which have historically been vital to the survival of the U.S. steel industry. Trade remedies enabled the U.S. steel industry to survive the last import crisis, and their effective enforcement is equally critical today.
- The excess capacity plaguing the steel industry stems largely from massive government support for, and direct government involvement in, the steel industry in other countries. In 2011, half of the world’s 46 top steel companies were state-owned, and these state-owned companies accounted for 38 percent of global production. These governments view their steel industries as strategic (i.e., important to grow regardless of profit), and thus governments provide a wide array of subsidies to their steel industries, including grants, tax breaks, subsidized loans and debt forgiveness, the provision of inputs at below market rates, direct equity infusions, and more. These factors lead to “uneconomic additions to capacity”—increases in capacity that don’t make economic sense because they are not driven by demand.
- U.S. imports of unfairly traded steel products are increasing as countries such as China and others sell dumped and subsidized “upstream” (basic) steel products to other countries, which use these inputs in the “downstream” (finished) products, like pipes, that they sell to the U.S. China and Korea accounted for more than three-fourths (77.9 percent) of the growth in global steel exports between 2003 and 2012. Imports of Chinese steel by South Korea and Japan rose sharply between 2009 and 2012; Korea and Japan, in turn, are themselves major exporters to the U.S.
- Aggressive government support, coupled with the industry’s capital-intensive nature (i.e., its difficulty ramping down production to handle drops in demand) leads to the kinds of trade distortions (overcapacity, export surges) now threatening the U.S. market. The last time this happened, in the early 2000s following the 1998 Asian financial crisis, trade remedies served as a vital line of defense. Trade remedies have provided significant benefits for the domestic industry and its workers, including resurgent shipments and sales revenue, improved operating performance, retained jobs, and the ability to make needed capital investments. In cases where relief is denied, the costs have been just as great, in some cases forcing the industry to endure additional years of injury before finally obtaining needed relief, or, worse, going out of business.
- Trade remedies are once again critical to the industry’s survival. U.S. steel producers filed 40 antidumping and countervailing duty petitions in 2013 and the first two months of 2014, covering nine products from 18 different countries. Determinations in these cases will be made later this year and in early 2015. Over 14,000 workers, producing the affected steel products in 92 locations across 29 states, depend on effective relief in these cases alone.
In short, trade remedies have been critical to the survival of the steel industry and the more than half-million workers who depend on that industry, particularly when the industry faces the kind of crisis that threatens it today. Policymakers should ensure that trade remedies are effectively enforced, that enforcement discretion is exercised consistent with the remedial goals of the statute (the Tariff Act of 1930, as amended), and that the remedies do in fact fully redress the unfair trade practices distorting the U.S. market. This requires that policymakers review areas in which changes in practice, methodologies, regulations, and the law may be needed to ensure that the steel industry and its workers can continue to rely on these vital tools.
I. Steel’s import crisis
The U.S. steel industry is in the midst of an import crisis resulting from a confluence of forces including the rapidly growing surplus in global steel capacity and a surge in unfair import competition. This section examines the dimensions of steel’s import crisis. Later sections examine the importance of steel production to the U.S. economy, review root causes of the crisis, present policy recommendations, and asses the importance of effective enforcement and enhancement of trade remedy laws.
A. Global overcapacity threatens U.S. steel industry viability
For decades, the global steel industry has been plagued by uneconomic production capacity additions which lead to market-distorting surges of exports by other countries in times of economic distress.
1. Global overcapacity is growing by any measure
Capacity is a measure of how much steel existing equipment could produce, while excess capacity is the difference between capacity and actual production. Prior to the mid-1970s, increases in global steel capacity were commensurate with increases in consumption; starting in 1974, however, a combination of foreign-government intervention in the steel industry and stagnant growth in consumption led to increases in capacity that outpaced increases in consumption (Howell et al. 1988). Since the mid-1970s, the U.S. steel industry has continued to face crisis after crisis as foreign-government-supported producers in this capital-intensive industry have used predatory trade practices, rather than rational restructuring and consolidation, to weather the storm when demand for steel collapses.
The U.S. steel industry and its workers face another such crisis today. In the aftermath of the global financial crisis in 2008, when demand plummeted, the global steel industry continued to add capacity. The capacity additions did not make rational economic sense in the devastated global marketplace, but many were made with the support and involvement of home-country governments eager to grow their steel industries regardless of the cost.
The huge growth in excess global production capacity that occurred in 2008 and 2009 continues to threaten the steel industry five years later. One measure of excess capacity is the capacity utilization rate, which shows how much of total production capacity is engaged in actual production. As Figure A shows, when the 2008 financial crisis decimated demand, capacity utilization (right axis) in the global steel industry dipped below 80 percent for the first time since 2000. In an industry where a capacity utilization rate of around 92 percent is considered “healthy,” the low 79 percent rate reached in 2008 was reminiscent of the 1980s and 1990s, when capacity utilization remained below 80 percent (Boston Consulting Group 2002; Howell et al. 1988).
Global crude steel production, capacity, and capacity utilization, 2000–2013
| Year | Production | Excess capacity | Capacity utilization rate (%) |
|---|---|---|---|
| 2000 | 850.156 | 228.644 | 78.81% |
| 2001 | 852.173 | 209.827 | 80.24% |
| 2002 | 905.155 | 221.745 | 80.32% |
| 2003 | 971.016 | 198.984 | 82.99% |
| 2004 | 1,062.541 | 182.459 | 85.34% |
| 2005 | 1,147.772 | 227.328 | 83.47% |
| 2006 | 1,250.473 | 202.527 | 86.06% |
| 2007 | 1,348.122 | 234.878 | 85.16% |
| 2008 | 1,342.625 | 358.275 | 78.94% |
| 2009 | 1,237.044 | 578.956 | 68.12% |
| 2010 | 1,432.750 | 484.250 | 74.74% |
| 2011 | 1,536.988 | 426.312 | 78.29% |
| 2012 | 1,545.011 | 499.689 | 75.56% |
| 2013 | 1,582.493 | 517.107 | 75.37% |
Sources: American Iron and Steel Institute et al. (2010); De Carvalho and Daniel (2012); World Steel Association (various years, 2013a)
The situation deteriorated even further in 2009, when global capacity utilization dropped to just 68 percent, and, as Figure A shows, it has remained below 80 percent since that time, with increases in 2010 and 2011 followed by declines in 2012 and 2013.
The excess capacity currently burdening the market is also large on an absolute basis. After declining in 2010 and 2011 from the peak reached in 2009, the volume of excess capacity grew in 2012 and 2013, as Figure B shows. Global excess production capacity is now over half a billion metric tons. This is more than twice the excess capacity that burdened the global steel market in the early 2000s in the wake of the 1998 Asian financial crisis.
Excess global crude steel capacity, 2000–2013
| Year | Millions of metric tons |
|---|---|
| 2000 | 228.644 |
| 2001 | 209.827 |
| 2002 | 221.745 |
| 2003 | 198.984 |
| 2004 | 182.459 |
| 2005 | 227.328 |
| 2006 | 202.527 |
| 2007 | 234.878 |
| 2008 | 358.275 |
| 2009 | 578.956 |
| 2010 | 484.250 |
| 2011 | 426.312 |
| 2012 | 499.689 |
| 2013 | 517.107 |
Sources: American Iron and Steel Institute et al. (2010); De Carvalho and Daniel (2012); World Steel Association (various years, 2013a)
The volume of excess capacity is so massive that there is little prospect the gap can be narrowed any time soon. Even if capacity were to remain flat, it is estimated that it would take until 2017 to 2019 for global consumption to catch up (De Carvalho 2012). But it is highly unlikely that capacity will remain flat. Instead, countries are continuing to invest in new capacity, further threatening the viability of the global steel industry. In far too many cases, these capacity additions are motivated by government support rather than economic fundamentals.
The persistently high overcapacity since 2008 has sparked serious concerns in the Organization for Economic Cooperation and Development (OECD) Steel Committee. On December 6, 2013, the chairman of the committee noted excess capacity had reached “very high levels” (Nezu 2013). The statement continued:
The financial performance of the industry could be viewed as worse now than during the crisis of the late 1990s. Recent trends in key financial indicators, such as profitability or indebtedness, raise serious concerns and suggest that the global industry is in a very difficult economic and financial situation … High levels of excess capacity cloud prospects for the industry’s profitability. As global steel demand is expected to grow slowly in the coming years and with many new investment projects coming on stream, excess capacity will continue to weigh on the operating profitability of the global steel industry. (Nezu 2013)
Other participants agreed that excess capacity is “one of the biggest challenges facing the steel industry” (Silva, Daniel, and De Carvalho 2013).
Large and growing excess capacity has significant impacts on the industry’s viability, and declines in the industry’s capacity utilization rate are tightly correlated with declining operating income (De Carvalho 2013). The OECD reports that the growth in capacity since the 2008 financial crisis has outpaced the growth seen in the wake of the 1998 Asian financial crisis; as a result, the steel industry’s financial performance from 2008 to 2012 was worse than it was between 1998 and 2001, in the wake of the 1998 Asian financial crisis (Silva, Daniel, and De Carvalho 2013). The industry is also burdened with large debt obligations and high costs (McKinsey 2013, World Steel Dynamics 2013). As global capacity utilization is expected to remain 75 percent or less in the coming years, the OECD predicts that operating profitability will likely remain at current unsustainable levels for a number of years (Silva, Daniel, and De Carvalho 2013).
Much of this excess capacity is located in China. By the end of 2012, crude steelmaking capacity in China had reached one billion metric tons, and China’s capacity utilization rate was just 72 percent (MOFCOM 2013). By some estimates, China accounted for more than a third of the world’s total excess steel capacity in 2012 (Han 2013). A 2013 report on the global steel industry, noting that excess capacity is the most significant issue for the sector, also explained that “the overproduction versus domestic demand from China is likely to persist as the country’s steel mills are required to maintain employment and GDP targets” (Ernst & Young 2013). The China Iron & Steel Association estimates that capacity will increase by another three percent in 2014 alone (Song 2014).
Units of mass used in this report
This report utilizes data from the American Iron and Steel Institute (AISI 2013) and various international sources. U.S. steel data are presented here in millions of net tons (MNTs). The net (or short) ton equals 2,000 pounds. International data are presented in metric tons (MTs), the measure used in most international reports. One MT is equal to 1,000 kg, or 1.102311 net tons. A common unit of measure is one million metric tons (MMT). The long (or gross) ton is used in the imperial system (in the U.K. and some other English-speaking countries) and equals 2,240 pounds. The long ton is not used here.
These additions will build upon the remarkable rise of China’s steel industry in recent decades. As discussed in more detail in Section III.A, this astronomical growth has been fueled by explicit government policies promoting China’s steel industry and massive government investment in the steel sector in China.
2. Excess capacity leads to overproduction and surges of exports
As Section III explains in more detail, the steel industry’s capital intensity, combined with state support for foreign steel producers, leads to excess capacity and production. This trend can be seen in recent data. Global steel production grew from 716 million metric tons in 1980 to an estimated 1,582 million metric tons in 2013 (World Steel Association various years). Most regions maintained relatively stable production during this time. As Figure C demonstrates, the growth in production can be attributed almost entirely to the exponential increase in Asia starting in the 1990s.
Crude steel production by region, 1980–2013
| Year | European Union (27) | North America | Asia | Rest of world |
|---|---|---|---|---|
| 1980 | 208.027 | 124.804 | 172.996 | 210.574 |
| 1981 | 200.913 | 132.404 | 164.367 | 209.545 |
| 1982 | 185.056 | 87.121 | 167.643 | 205.735 |
| 1983 | 184.805 | 97.193 | 168.718 | 213.031 |
| 1984 | 198.957 | 106.812 | 181.849 | 222.628 |
| 1985 | 199.027 | 102.779 | 188.022 | 229.075 |
| 1986 | 190.492 | 96.218 | 189.261 | 238.009 |
| 1987 | 191.215 | 104.174 | 198.114 | 242.000 |
| 1988 | 203.011 | 114.105 | 214.580 | 248.406 |
| 1989 | 203.687 | 112.920 | 223.398 | 245.934 |
| 1990 | 191.820 | 111.447 | 233.774 | 233.388 |
| 1991 | 181.823 | 101.391 | 242.718 | 207.660 |
| 1992 | 173.837 | 107.980 | 242.986 | 194.994 |
| 1993 | 174.611 | 113.403 | 259.892 | 179.663 |
| 1994 | 184.829 | 116.187 | 260.993 | 163.097 |
| 1995 | 190.661 | 122.726 | 274.933 | 164.867 |
| 1996 | 178.125 | 124.476 | 283.413 | 164.976 |
| 1997 | 193.866 | 129.489 | 303.650 | 172.849 |
| 1998 | 191.057 | 129.945 | 293.452 | 164.076 |
| 1999 | 182.185 | 130.044 | 304.738 | 173.243 |
| 2000 | 193.387 | 135.374 | 329.380 | 192.015 |
| 2001 | 187.452 | 119.857 | 350.419 | 194.445 |
| 2002 | 188.246 | 122.949 | 390.677 | 203.283 |
| 2003 | 192.511 | 126.161 | 437.699 | 214.645 |
| 2004 | 202.523 | 134.021 | 497.545 | 228.452 |
| 2005 | 195.608 | 127.631 | 593.153 | 231.380 |
| 2006 | 207.306 | 131.789 | 669.665 | 241.713 |
| 2007 | 210.185 | 132.618 | 751.862 | 253.457 |
| 2008 | 198.616 | 124.494 | 777.986 | 241.529 |
| 2009 | 139.393 | 82.578 | 806.967 | 208.106 |
| 2010 | 172.816 | 111.562 | 911.973 | 236.399 |
| 2011 | 177.717 | 188.675 | 988.537 | 182.059 |
| 2012 | 168.592 | 121.608 | 1,005.765 | 249.046 |
| 2013 | 165.601 | 119.251 | 1,059.151 | 238.490 |
Sources: World Steel Association (various years, 2013a, 2013b)
While a number of Asian countries have increased their steel production in the past 30 years, the vast majority of the increase in production is attributable to China, as can be seen in Figure D. China alone increased its production from 37.1 million metric tons in 1980 to 779.0 million metric tons in 2013, and China’s production grew from 5 percent of global production to 49 percent of global production during that period. In contrast, production in countries that had accounted for the largest proportion of global steel production in 1980 stayed flat or experienced declines. From 1980 to 2013, production in the United States decreased from 101.5 million metric tons to 87.0 million metric tons, European production fell from 208.0 to 165.6 million metric tons, and Japanese production stayed essentially flat at about 111 million metric tons.
Crude steel production by country, 1980–2013
| Year | Rest of world | European Union (27) | United States | Japan | India | South Korea | China |
|---|---|---|---|---|---|---|---|
| 1980 | 240.331 | 208.027 | 101.455 | 111.395 | 9.514 | 8.558 | 37.121 |
| 1981 | 237.905 | 200.913 | 109.613 | 101.676 | 10.765 | 10.753 | 35.604 |
| 1982 | 233.381 | 185.056 | 67.655 | 99.548 | 10.997 | 11.758 | 37.160 |
| 1983 | 242.829 | 184.805 | 76.761 | 97.179 | 10.237 | 11.915 | 40.021 |
| 1984 | 254.706 | 198.957 | 83.939 | 105.586 | 10.549 | 13.034 | 43.475 |
| 1985 | 262.261 | 199.027 | 80.067 | 105.279 | 11.936 | 13.539 | 46.794 |
| 1986 | 272.222 | 190.492 | 74.031 | 98.275 | 12.197 | 14.555 | 52.208 |
| 1987 | 278.716 | 191.215 | 80.876 | 98.513 | 13.121 | 16.782 | 56.280 |
| 1988 | 287.903 | 203.011 | 90.650 | 105.681 | 14.309 | 19.118 | 59.430 |
| 1989 | 287.423 | 203.687 | 88.852 | 107.909 | 14.608 | 21.873 | 61.587 |
| 1990 | 274.106 | 191.820 | 89.726 | 110.339 | 14.963 | 23.125 | 66.350 |
| 1991 | 248.281 | 181.823 | 79.738 | 109.649 | 17.100 | 26.001 | 71.000 |
| 1992 | 236.394 | 173.837 | 84.322 | 98.132 | 18.117 | 28.055 | 80.940 |
| 1993 | 223.801 | 174.611 | 88.793 | 99.623 | 18.155 | 33.026 | 89.560 |
| 1994 | 205.101 | 184.829 | 91.244 | 98.295 | 19.282 | 33.745 | 92.610 |
| 1995 | 211.560 | 190.661 | 95.191 | 101.640 | 22.003 | 36.772 | 95.360 |
| 1996 | 214.636 | 178.125 | 95.535 | 98.801 | 23.753 | 38.903 | 101.237 |
| 1997 | 227.078 | 193.866 | 98.485 | 104.545 | 24.415 | 42.554 | 108.911 |
| 1998 | 217.303 | 191.057 | 98.658 | 93.548 | 23.480 | 39.896 | 114.588 |
| 1999 | 227.114 | 182.185 | 97.427 | 94.192 | 24.296 | 41.042 | 123.954 |
| 2000 | 249.970 | 193.387 | 101.824 | 106.444 | 26.924 | 43.107 | 128.500 |
| 2001 | 248.976 | 187.452 | 90.102 | 102.866 | 27.291 | 43.852 | 151.634 |
| 2002 | 261.123 | 188.246 | 91.587 | 107.746 | 28.814 | 45.390 | 182.249 |
| 2003 | 273.892 | 192.511 | 93.677 | 110.511 | 31.779 | 46.310 | 222.336 |
| 2004 | 294.674 | 202.523 | 99.681 | 112.718 | 32.626 | 47.521 | 272.798 |
| 2005 | 295.406 | 195.608 | 94.897 | 112.471 | 45.780 | 47.820 | 355.790 |
| 2006 | 309.455 | 207.306 | 98.557 | 116.226 | 49.450 | 48.455 | 421.024 |
| 2007 | 324.935 | 210.185 | 98.102 | 120.203 | 53.468 | 51.517 | 489.712 |
| 2008 | 310.165 | 198.616 | 91.350 | 118.739 | 57.791 | 53.625 | 512.339 |
| 2009 | 262.752 | 139.393 | 58.196 | 87.534 | 63.527 | 48.572 | 577.070 |
| 2010 | 303.207 | 172.816 | 80.495 | 109.599 | 68.976 | 58.914 | 638.743 |
| 2011 | 321.314 | 177.717 | 86.398 | 107.601 | 73.471 | 68.519 | 701.968 |
| 2012 | 317.316 | 168.592 | 88.695 | 107.232 | 77.561 | 69.073 | 716.542 |
| 2013 | 293.106 | 165.601 | 86.955 | 110.570 | 81.213 | 66.008 | 779.040 |
Sources: World Steel Association (various years, 2013a, 2013b)
While much of China’s production growth was driven by rising demand in China, that growth has now outstripped demand, making China not only the largest steel producer, but also the largest exporter and a net exporter to the rest of the world. In 2000, China’s steel production was still below its domestic steel usage, with a gap of about 35 million metric tons; by 2012, China was producing 29 million more metric tons than it used domestically (World Steel Association 2013b) which is equal to one-third of total U.S. domestic production. As noted by Ernst & Young (2013), China’s exports have ripple effects around the world, as they are destined for almost every region around the globe, including countries in Asia that are also major exporters.
Though China is by far the biggest player in the global steel industry, it is not alone in its growth and continued investments in new capacity and thus, production. Figure D shows that significant increases in production from 1980 to 2013 were also made by India (from 9.5 million metric tons to 81.2 million metric tons) and South Korea (from 8.6 million metric tons to 66.0 million metric tons).
India has significant overcapacity, and with large additions to capacity planned despite stagnant demand, that overcapacity is likely to grow in the coming years. While India produced 73 to 78 million metric tons in 2011 and 2012 (World Steel Association 2013b), this was only 82 to 88 percent of its overall capacity, which totaled around 89 million metric tons in 2011 to 2012 (Economic Times 2013). Major producers in India expect to add an additional 24 million metric tons of capacity by 2017–2018, and India’s overall capacity is projected to more than double to reach 200 million metric tons by 2020 (ibid.).
According to a 2013 report, there have also been “sharp increases in capacity in Korea with demand remaining stagnant,” leading to persistent oversupply problems (Ernst & Young 2013). The report continues, “The sharp correction in steel prices [in Korea] is a result of capacity oversupply and excess inventory in the system …. Despite poor demand, Korean steelmakers have continued to expand their supply …. Although this pace of production is slow, it is still enough to worsen the oversupply situation.”
More detailed public data regarding the excess capacity plaguing Korea’s steel industry is available for the oil country tubular goods (OCTG) industry, the industry that provides oil pipelines. OCTG is a product that is not used domestically in Korea, but is solely manufactured for export. Korean OCTG capacity grew by 21.1 percent from 2010 to 2012, enabling a 47.4 percent increase in Korean exports, over 90 percent of which were destined for the United States (USITC 2013a). As detailed in Section III.A, the Korean and Indian governments, as with the Chinese government, have also provided significant subsidies to their steel industries over the years.
Additional investments are being made in other countries across the globe, and plans for capacity additions have been announced by steelmakers in every region of the world (Breakbulk 2013; De Carvalho 2013). As one article explained, “Companies in Vietnam, Argentina, Ecuador, Peru and Bolivia, all backed in some way by governments, are planning new mills” (Industry Today 2013).
3. In summary
The massive increase in global steel production capacity driven by Asia (and particularly China) since the 1990s has continued since the 2008 financial crisis as governments in China and other countries pour resources into new capacity regardless of market fundamentals. As a result, in the context of a slow and faltering global recovery, excess capacity has remained exceedingly high. In 2013, global excess capacity hit over half a billion metric tons, more than twice the amount seen in the early 2000s in the wake of the Asian financial crisis of 1998.
The huge and growing overhang is a major concern for steel producers around the world. And it is driving the global industry’s performance to levels that some have characterized as even worse than that experienced during the previous crisis. This overcapacity will likely continue if not worsen in coming years as more investments are made and the recovery continues at a slow pace.
B. Global overcapacity is harming U.S. steel producers and workers
The rapid growth in excess global steel production capacity has resulted in rising U.S. imports, falling import prices, and declining average unit values, which have depressed domestic steel production and revenues, leading to sharp declines in net income in the U.S. steel industry over the past two years, with $1.2 billion in net losses in 2013 alone. Workers in the domestic steel industry have suffered lost jobs and reduced wages (as noted in the OCTG and wire rod cases described later in this report), and are threatened by a new round of layoffs if losses in the domestic industry are not reversed.
1. Imports are capturing a growing share of the U.S. steel market
Imports of finished and semifinished steel products captured a growing share of the U.S. market between 2003 and 2013, as shown in Figure E. The import share of the U.S. market for semifinished and finished steel products (top line in Figure E) increased by half (50.0 percent) between 2003 and 2013, rising from 19.9 percent to 29.9 percent, an increase of 10.0 percentage points. The growth in gross imports reflects, in part, growing imports of slabs, ingots, billets, and other semifinished steel products.
Import share of U.S. steel products market, 2003–2013
| Year | Semifinished and finished steel products | Finished steel products |
|---|---|---|
| 2003 | 19.9% | 15.8% |
| 2004 | 27.2% | 21.5% |
| 2005 | 26.6% | 20.9% |
| 2006 | 33.4% | 26.5% |
| 2007 | 27.3% | 21.8% |
| 2008 | 28.8% | 23.4% |
| 2009 | 24.2% | 21.1% |
| 2010 | 26.5% | 20.9% |
| 2011 | 28.4% | 21.8% |
| 2012 | 31.0% | 23.9% |
| 2013 | 29.9% | 23.1% |
Source: Economic Policy Institute analysis of forthcoming data provided by American Iron and Steel Institute (AISI 2014a)
Although not shown, the data sources for Figure E reveal that U.S. imports of semifinished products increased 52.0 percent between 2003 and 2013. The growing trade in semifinished steel reflects, in part, the accumulation of global excess steel production capacity (Figure B, earlier), and tremendous growth in crude steel production over the past decade, much of it in China (Figure D, earlier). Imports of steel products, especially semifinished steel, as a share of the overall U.S. market surged in 2006 (as shown in Figure E), when U.S. consumption (production plus imports minus exports) of steel products (not shown) reached 135.7 million net tons, the highest level in the past decade. Strong domestic demand is a magnet for steel imports.
The import share of the U.S. market for finished steel products (bottom line in Figure E) increased by nearly half (46.3 percent), from 15.8 percent in 2003 to 23.1 percent in 2013, an increase of 7.3 percentage points.
Figure F shows the absolute growth in U.S. steel imports (in millions of net tons). Imports increased 17.4 percent between 2011 and 2012. Imports declined slightly in 2013, but remained well above levels in 2011. The United States imported 32.0 million net tons of steel in 2013, an increase of 12.3 percent from 2011.
Annual and year-to-date U.S. imports of steel products, 2011–2014
| Annual | Imports of total steel products (millions of net tons) |
|---|---|
| 2011 | 28.5 |
| 2012 | 33.5 |
| 2013 | 32.0 |
| Jan.–Feb. 2013 | 5.1 |
| Jan.–Feb. 2014 | 6.4 |
Source: Economic Policy Institute analysis of forthcoming data provided by the American Iron and Steel Institute (AISI 2014a)
Imports surged again in the first two months of 2014, to 6.4 million net tons from 5.1 million net tons in January–February 2013, an increase of 24.5 percent. Domestic shipments (not shown) have fallen 0.9 percent over the same period, according to the American Iron and Steel Institute (AISI 2014b). The estimated import share of the domestic market jumped 4.5 percentage points in January–February 2014 (18.5 percent), relative to the same period in 2013. If imports continue to grow at this rate through all of 2014, domestic producers and steelworkers will inevitably suffer from reduced output, continued operating losses, and layoffs.
2. Imports are capturing market share with lower prices
One way that imports injure domestic producers is by underselling domestic steel products. Since 2011, the average price of imported steel, as reflected in the average unit value (AUV) per net ton of U.S. steel imports, has fallen sharply, as shown in Figure G. Import unit values declined steadily throughout the period shown. The AUV of imported steel declined $169 per ton, (15.0 percent) between 2011 and 2013. In the first two months of 2014, import unit values declined $118 per ton (12.0 percent) compared with the same period in 2013. The rate of decline in the price of imported steel accelerated over the past year, with AUVs falling nearly as fast (in terms of the rate of change per year) in interim 2014 as they did in the preceding full two-year period.
Average unit values for all U.S. imports of steel products, 2011–2014
| Annual | Average unit values of steel imports (C.I.F $/net ton) |
|---|---|
| 2011 | $1,123 |
| 2012 | $1,070 |
| 2013 | $955 |
| Jan.–Feb. 2013 | $982 |
| Jan.–Feb. 2014 | $864 |
Source: Economic Policy Institute analysis of forthcoming data provided by American Iron and Steel Institute (AISI 2014a)
Overall, AUVs for imported steel declined by $259 per ton between 2011 and January–February 2014, a total decline of 23.1 percent (combining overlapping periods). Rapidly declining import AUVs have depressed domestic steel prices and profitability, as explored in the next subsection. Surging imports of unfairly traded steel are a clear and present threat to the health of the domestic steel industry.
3. Rising imports of unfairly traded, low-cost steel are suppressing domestic prices
As reviewed in more detail in Section I.C later in this report, there has been a surge in antidumping and countervailing duty cases filed since January of 2013, with petitions on nine different steel products from 18 different countries in 2013 and the first quarter of 2014. Taken together, these cases show that the surge of imports (shown in Figure F) reflects unfair trade practices.
This subsection of the report explores how the surge of imports has depressed domestic steel industry prices and net income. Prices of all steel products were depressed in 2009 by the Great Recession, recovered in 2010, stabilized in 2011, and began to decline in early- to mid-2012 as the volume of U.S. steel imports surged and import AUVs fell.
Figure H shows how trends in prices differ for upstream products (steel ingots and semifinished products) and downstream products (oil country tubular goods, etc.). Prices of steel ingots and other semifinished (upstream) products have largely been flat since 2011, peaking in August 2012 and falling only 1.8 percent through February 2014. Steel pipe and tube products such as OCTG standard and line pipe are made from semifinished products such as steel strip, plate, and billets.1 Thus, the cost of primary inputs used to make finished pipe products was stable over the past three years. However, the price of the final products fell, thus reinforcing substantial cause for concern about the impacts of dumping and subsidies in these markets.
Prices of U.S.-made upstream (ingots and semifinished) and downstream (finished) steel products, 2010–2014
| Month | Steel ingots and semifinished products other than wire rod | Oil country tubular goods (OCTG), standard, line pipe |
|---|---|---|
| 2010/12/01 | 100 | 100.0 |
| 2011/01/01 | 101 | 104.7 |
| 2011/02/01 | 106.3 | 114.6 |
| 2011/03/01 | 109.1 | 119.6 |
| 2011/04/01 | 110.6 | 120.3 |
| 2011/05/01 | 109.3 | 119.5 |
| 2011/06/01 | 113.3 | 117.1 |
| 2011/07/01 | 113.5 | 116.9 |
| 2011/08/01 | 113.7 | 116.9 |
| 2011/09/01 | 113.7 | 118.5 |
| 2011/10/01 | 114.3 | 118.5 |
| 2011/11/01 | 113.1 | 118.6 |
| 2011/12/01 | 112.5 | 118.2 |
| 2012/01/01 | 113.6 | 118.2 |
| 2012/02/01 | 113.8 | 119.9 |
| 2012/03/01 | 116.5 | 119.8 |
| 2012/04/01 | 115.9 | 120.8 |
| 2012/05/01 | 115.3 | 120.1 |
| 2012/06/01 | 114.2 | 119.5 |
| 2012/07/01 | 115.3 | 115.0 |
| 2012/08/01 | 116.7 | 113.1 |
| 2012/09/01 | 115.4 | 112.0 |
| 2012/10/01 | 113.7 | 110.4 |
| 2012/11/01 | 113.7 | 110.2 |
| 2012/12/01 | 112.9 | 110.0 |
| 2013/01/01 | 113 | 107.4 |
| 2013/02/01 | 112.9 | 104.2 |
| 2013/03/01 | 114 | 102.5 |
| 2013/04/01 | 113.6 | 102.0 |
| 2013/05/01 | 112.4 | 101.3 |
| 2013/06/01 | 111.4 | 100.5 |
| 2013/07/01 | 111.4 | 101.0 |
| 2013/08/01 | 110.6 | 101.6 |
| 2013/09/01 | 110.4 | 102.0 |
| 2013/10/01 | 110.9 | 101.4 |
| 2013/11/01 | 110.9 | 101.25 |
| 2013/12/01 | 111.3 | 101.1 |
| 2014/01/01 | 112.3 | 102.3 |
| 2014/02/01 | 114.6 | 101.5 |
Note: These price indexes are for carbon steel products.
Source: Economic Policy Institute analysis of Bureau of Labor Statistics Producer Price Index (BLS 2013)
There was a steep drop in the price of finished products such as carbon steel OCTG, standard pipe, and line pipe, which peaked in April 2012 and declined 16.0 percent through February 2014. The sharp drop in pipe prices is strongly correlated with the 23.1 decline in total import average unit values between 2011 and February, 2014, shown in Figure G. This suggests that domestic producers of finished steel products were subjected to a price-cost squeeze over the past two years, which had a strong, negative effect on net income in this period, as shown in Figure J, in subsection B.4. below.
Likewise, the more than 50 percent increase in the U.S. import share of finished and semifinished steel products between 2003 and 2013 (Figure E) combined with the 10 percent decline in the domestic industry’s net shipments in the same period (AISI 2014a) suggest that surging imports of unfairly traded steel have taken market share and production away from U.S. steel producers.
4. Financial performance in the U.S. steel industry has taken a hit
U.S. steel shipments were high and stable between 2003 and 2007, averaging 107.7 million net tons per year (Figure I). Net sales (total revenues) increased steadily and reached a peak of $66.6 billion in 2008, coinciding with the boom in U.S shale gas drilling.2 Steel shipments (in millions of net tons) and net sales (in billions of dollars) fell sharply in 2009, in the wake of the Great Recession,3 and while shipments have nearly recovered to their 2008 levels, net sales have fallen from their post-recession peak of $54.4 billion in 2011 to $49.4 billion in 2013.
U.S. steel shipments and net sales, 2003–2013
| Year | Shipments (millions of net tons) | Net sales (billions of dollars) |
|---|---|---|
| 2003 | 106.0 | 33.1 |
| 2004 | 111.4 | 38.5 |
| 2005 | 105.0 | 41.2 |
| 2006 | 109.5 | 42.7 |
| 2007 | 106.4 | 48.1 |
| 2008 | 98.5 | 66.6 |
| 2009 | 62.2 | 32.2 |
| 2010 | 83.4 | 46.6 |
| 2011 | 91.9 | 54.4 |
| 2012 | 95.9 | 52.0 |
| 2013 | 95.4 | 49.4 |
Source: Economic Policy Institute analysis of forthcoming data provided by American Iron and Steel Institute (AISI 2014a)
The post-recession trends, including the downturn in shipments (down 0.5 percent in 2013) and net sales (down a cumulative 9.1 percent in 2012 and 2013) due to the latest surge in imports have created financial distress for domestic steel producers. One measure of that stress is provided by trends in gross revenues (net sales) per net ton shipped (derived from the data in figure I but not shown). After peaking at $676 in 2008, revenues per net ton fell to $518 in 2009, recovered somewhat in 2010 and 2011, but fell back down to $518 in 2013.
That revenues per net ton declined 8.5 percent from 2011 to 2012 and 4.4 percent from 2012 to 2013 is an important indicator of the negative impact of the most recent surge of imports of excess, and in some cases, unfairly traded, steel (see Section I.C, below, for a summary of recent unfair trade complaints involving steel products).
Declining revenues do not necessarily imply that domestic producers will experience deteriorating financial performance. Cost reductions can offset the effects of declining sales on net income. U.S. steel producers are among the most efficient in the world. U.S. steelmakers have steadily improved energy efficiency (which has increased 27 percent since 1990) and reduced man-hours per ton by 35.7 percent between 2000 and 2012 (AISI 2013, 14–15). Despite these improvements, domestic producers have not been able to offset the effects of rapid declines in revenues per ton and shipments in 2012 and 2013.
U.S. steel producers’ income (net and as a share of sales) is reported in Figure J. Domestic producers’ net income averaged 7.7 percent of sales between 2004 and 2008. The industry lost $1.7 billion (5.4 percent of sales) in 2009 in the wake of the recession. Domestic steel producers finally returned to profitability in 2011, after two years of recession-induced losses.
U.S. steel producers' net income, and income as a share of net sales, 2003–2013
| Year | Net income (millions of dollars) | Net income as a % of net sales |
|---|---|---|
| 2003 | $-6,881 | -20.8% |
| 2004 | $3,216 | 8.3% |
| 2005 | $2,918 | 7.0% |
| 2006 | $3,861 | 9.0% |
| 2007 | $3,360 | 7.0% |
| 2008 | $4,701 | 7.1% |
| 2009 | $-1,746 | -5.4% |
| 2010 | $-251 | -0.5% |
| 2011 | $914 | 1.7% |
| 2012 | $-388 | -0.7% |
| 2013 | $-1,198 | -2.4% |
Source: Economic Policy Institute analysis of forthcoming data provided by American Iron and Steel Institute (AISI 2014a)
As a capital-intensive, cyclical business, domestic steel producers depend on earning stable, consistent profits during recoveries in order to cover losses during downturns. However, the sharp, 4.4 percent decline in net sales in 2012 (from Figure I, above) pushed the industry back into the red in 2012, when domestic producers lost $388 million (0.7 percent of net sales). Falling shipments and net sales resulted in a much greater net loss of $1.2 billion in 2013 (2.4 percent of net sales).
Domestic steel producers have now absorbed net losses totaling $3.6 billion in four out of the last five years (2009–2013), including roughly $1.6 billion in losses in 2012 and 2013 alone, as shown in Figure J.
5. Recent business-cycle indicators suggest that the U.S. steel import crisis is accelerating
Because of the capital-intensive nature of steel production, plants must be operated nearly 24 hours per day, 7 days per week for peak efficiency. Some downtime is required for maintenance and changes in product mix, but capacity utilization rates of about 92 percent or more are required for “healthy” production, as noted earlier. Capacity utilization in the U.S. steel industry was reasonably healthy in 2007 and through the summer of 2008, averaging 87.6 percent, but dipped into the 30 percent to 70 percent range from late 2008 through late 2010 and has remained low, ranging between 70 and 80 percent, as shown in Figure K.
Capacity utilization in U.S. steel industry, 2007–2014
| Month | Capacity utilization in production of iron and steel products |
|---|---|
| 2007/01/01 | 84.8% |
| 2007/02/01 | 84.2% |
| 2007/03/01 | 84.9% |
| 2007/04/01 | 86.2% |
| 2007/05/01 | 85.6% |
| 2007/06/01 | 84.6% |
| 2007/07/01 | 85.3% |
| 2007/08/01 | 84.8% |
| 2007/09/01 | 82.3% |
| 2007/10/01 | 88.4% |
| 2007/11/01 | 91.7% |
| 2007/12/01 | 92.1% |
| 2008/01/01 | 92.7% |
| 2008/02/01 | 92.9% |
| 2008/03/01 | 90.1% |
| 2008/04/01 | 92.7% |
| 2008/05/01 | 89.2% |
| 2008/06/01 | 88.5% |
| 2008/07/01 | 90.6% |
| 2008/08/01 | 87.0% |
| 2008/09/01 | 80.5% |
| 2008/10/01 | 70.5% |
| 2008/11/01 | 56.2% |
| 2008/12/01 | 46.3% |
| 2009/01/01 | 44.7% |
| 2009/02/01 | 44.8% |
| 2009/03/01 | 40.3% |
| 2009/04/01 | 40.1% |
| 2009/05/01 | 41.0% |
| 2009/06/01 | 44.7% |
| 2009/07/01 | 52.2% |
| 2009/08/01 | 55.0% |
| 2009/09/01 | 59.0% |
| 2009/10/01 | 62.5% |
| 2009/11/01 | 62.7% |
| 2009/12/01 | 65.2% |
| 2010/01/01 | 66.1% |
| 2010/02/01 | 68.7% |
| 2010/03/01 | 73.2% |
| 2010/04/01 | 71.8% |
| 2010/05/01 | 74.0% |
| 2010/06/01 | 72.6% |
| 2010/07/01 | 66.7% |
| 2010/08/01 | 67.7% |
| 2010/09/01 | 69.9% |
| 2010/10/01 | 67.5% |
| 2010/11/01 | 71.0% |
| 2010/12/01 | 73.4% |
| 2011/01/01 | 74.0% |
| 2011/02/01 | 73.2% |
| 2011/03/01 | 74.1% |
| 2011/04/01 | 72.3% |
| 2011/05/01 | 71.4% |
| 2011/06/01 | 73.9% |
| 2011/07/01 | 73.7% |
| 2011/08/01 | 75.9% |
| 2011/09/01 | 75.7% |
| 2011/10/01 | 76.8% |
| 2011/11/01 | 77.6% |
| 2011/12/01 | 80.9% |
| 2012/01/01 | 78.6% |
| 2012/02/01 | 80.1% |
| 2012/03/01 | 77.5% |
| 2012/04/01 | 79.5% |
| 2012/05/01 | 78.6% |
| 2012/06/01 | 75.4% |
| 2012/07/01 | 75.6% |
| 2012/08/01 | 77.0% |
| 2012/09/01 | 70.5% |
| 2012/10/01 | 71.7% |
| 2012/11/01 | 75.4% |
| 2012/12/01 | 75.7% |
| 2013/01/01 | 75.5% |
| 2013/02/01 | 74.6% |
| 2013/03/01 | 72.7% |
| 2013/04/01 | 74.3% |
| 2013/05/01 | 75.1% |
| 2013/06/01 | 74.6% |
| 2013/07/01 | 78.3% |
| 2013/08/01 | 76.4% |
| 2013/09/01 | 76.6% |
| 2013/10/01 | 79.9% |
| 2013/11/01 | 78.1% |
| 2013/12/01 | 75.9% |
| 2014/01/01 | 74.6% |
| 2014/02/01 | 73.0% |
Source: Economic Policy Institute analysis of Federal Reserve Board (FRB 2014)
In fact, U.S. steel capacity utilization has declined every month since October 2013, falling from 79.9 percent to 73.0 percent in February 2014, a cumulative decline of 6.9 percentage points (8.6 percent) in capacity utilization. While not yet at recession levels, this sharp decline suggests that, if continued, the steel industry’s losses could deepen in 2014.
6. Surging, low-cost imports are threatening domestic steel employment
Rapidly growing imports of semifinished and finished steel products over the past decade have harmed domestic producers and steelworkers by displacing production and sales of domestically manufactured steel products, reducing U.S. steel production and employment.
Figure L shows the decline in steel industry employment since 1990, reflecting the periodic crises raised by chronic and growing overcapacity, as covered earlier. The last major steel crisis occurred in 1999–2003, a period when surging imports pushed 33 U.S. steel companies into bankruptcy (USITC 2005, 5). On March 20, 2002, President George W. Bush imposed tariffs and a tariff-rate quota on steel from many countries in response to a safeguard investigation under section 201 of the Trade Act of 1974 (USITC 2005, 1).
U.S. steel employment, 1990–2014
| Month | Total steel employment (thousands of employees) |
|---|---|
| 1990/01/01 | 258.2 |
| 1990/02/01 | 257.7 |
| 1990/03/01 | 257.6 |
| 1990/04/01 | 257.5 |
| 1990/05/01 | 257.5 |
| 1990/06/01 | 257.8 |
| 1990/07/01 | 258.4 |
| 1990/08/01 | 257.2 |
| 1990/09/01 | 256.4 |
| 1990/10/01 | 256.6 |
| 1990/11/01 | 256.6 |
| 1990/12/01 | 255.0 |
| 1991/01/01 | 256.2 |
| 1991/02/01 | 248.7 |
| 1991/03/01 | 248.0 |
| 1991/04/01 | 247.6 |
| 1991/05/01 | 245.8 |
| 1991/06/01 | 244.3 |
| 1991/07/01 | 243.8 |
| 1991/08/01 | 243.1 |
| 1991/09/01 | 242.6 |
| 1991/10/01 | 239.7 |
| 1991/11/01 | 238.1 |
| 1991/12/01 | 238.2 |
| 1992/01/01 | 238.2 |
| 1992/02/01 | 237.8 |
| 1992/03/01 | 237.1 |
| 1992/04/01 | 235.9 |
| 1992/05/01 | 235.0 |
| 1992/06/01 | 234.6 |
| 1992/07/01 | 233.1 |
| 1992/08/01 | 232.8 |
| 1992/09/01 | 231.5 |
| 1992/10/01 | 229.1 |
| 1992/11/01 | 227.3 |
| 1992/12/01 | 225.6 |
| 1993/01/01 | 225.4 |
| 1993/02/01 | 225.3 |
| 1993/03/01 | 224.9 |
| 1993/04/01 | 224.2 |
| 1993/05/01 | 223.9 |
| 1993/06/01 | 222.8 |
| 1993/07/01 | 222.9 |
| 1993/08/01 | 222.9 |
| 1993/09/01 | 222.9 |
| 1993/10/01 | 222.7 |
| 1993/11/01 | 223.9 |
| 1993/12/01 | 224.0 |
| 1994/01/01 | 225.0 |
| 1994/02/01 | 224.0 |
| 1994/03/01 | 222.8 |
| 1994/04/01 | 220.9 |
| 1994/05/01 | 220.5 |
| 1994/06/01 | 222.0 |
| 1994/07/01 | 223.1 |
| 1994/08/01 | 221.8 |
| 1994/09/01 | 222.6 |
| 1994/10/01 | 223.0 |
| 1994/11/01 | 223.0 |
| 1994/12/01 | 224.0 |
| 1995/01/01 | 223.8 |
| 1995/02/01 | 223.7 |
| 1995/03/01 | 224.0 |
| 1995/04/01 | 224.3 |
| 1995/05/01 | 224.6 |
| 1995/06/01 | 225.0 |
| 1995/07/01 | 224.0 |
| 1995/08/01 | 224.8 |
| 1995/09/01 | 223.6 |
| 1995/10/01 | 223.3 |
| 1995/11/01 | 224.7 |
| 1995/12/01 | 224.7 |
| 1996/01/01 | 224.9 |
| 1996/02/01 | 224.3 |
| 1996/03/01 | 223.8 |
| 1996/04/01 | 223.7 |
| 1996/05/01 | 224.1 |
| 1996/06/01 | 223.5 |
| 1996/07/01 | 223.3 |
| 1996/08/01 | 223.7 |
| 1996/09/01 | 222.9 |
| 1996/10/01 | 219.6 |
| 1996/11/01 | 219.4 |
| 1996/12/01 | 219.0 |
| 1997/01/01 | 219.6 |
| 1997/02/01 | 219.2 |
| 1997/03/01 | 219.2 |
| 1997/04/01 | 218.5 |
| 1997/05/01 | 217.4 |
| 1997/06/01 | 217.7 |
| 1997/07/01 | 217.2 |
| 1997/08/01 | 216.9 |
| 1997/09/01 | 218.0 |
| 1997/10/01 | 218.5 |
| 1997/11/01 | 218.8 |
| 1997/12/01 | 217.9 |
| 1998/01/01 | 218.2 |
| 1998/02/01 | 217.9 |
| 1998/03/01 | 217.6 |
| 1998/04/01 | 217.2 |
| 1998/05/01 | 217.7 |
| 1998/06/01 | 218.1 |
| 1998/07/01 | 217.0 |
| 1998/08/01 | 216.8 |
| 1998/09/01 | 216.8 |
| 1998/10/01 | 214.4 |
| 1998/11/01 | 212.3 |
| 1998/12/01 | 212.7 |
| 1999/01/01 | 212.2 |
| 1999/02/01 | 212.0 |
| 1999/03/01 | 212.0 |
| 1999/04/01 | 211.7 |
| 1999/05/01 | 211.5 |
| 1999/06/01 | 210.2 |
| 1999/07/01 | 210.4 |
| 1999/08/01 | 210.1 |
| 1999/09/01 | 210.3 |
| 1999/10/01 | 210.2 |
| 1999/11/01 | 210.8 |
| 1999/12/01 | 210.7 |
| 2000/01/01 | 211.1 |
| 2000/02/01 | 211.0 |
| 2000/03/01 | 211.7 |
| 2000/04/01 | 210.0 |
| 2000/05/01 | 209.0 |
| 2000/06/01 | 209.1 |
| 2000/07/01 | 209.4 |
| 2000/08/01 | 208.6 |
| 2000/09/01 | 205.3 |
| 2000/10/01 | 205.1 |
| 2000/11/01 | 204.4 |
| 2000/12/01 | 203.3 |
| 2001/01/01 | 201.4 |
| 2001/02/01 | 200.3 |
| 2001/03/01 | 198.7 |
| 2001/04/01 | 196.3 |
| 2001/05/01 | 194.1 |
| 2001/06/01 | 191.1 |
| 2001/07/01 | 188.0 |
| 2001/08/01 | 185.3 |
| 2001/09/01 | 183.0 |
| 2001/10/01 | 181.2 |
| 2001/11/01 | 178.2 |
| 2001/12/01 | 175.4 |
| 2002/01/01 | 173.3 |
| 2002/02/01 | 171.7 |
| 2002/03/01 | 170.2 |
| 2002/04/01 | 169.5 |
| 2002/05/01 | 170.1 |
| 2002/06/01 | 169.9 |
| 2002/07/01 | 169.9 |
| 2002/08/01 | 170.3 |
| 2002/09/01 | 170.3 |
| 2002/10/01 | 170.1 |
| 2002/11/01 | 170.0 |
| 2002/12/01 | 169.4 |
| 2003/01/01 | 169.3 |
| 2003/02/01 | 168.5 |
| 2003/03/01 | 167.6 |
| 2003/04/01 | 166.6 |
| 2003/05/01 | 164.3 |
| 2003/06/01 | 162.2 |
| 2003/07/01 | 161.7 |
| 2003/08/01 | 161.3 |
| 2003/09/01 | 159.8 |
| 2003/10/01 | 158.9 |
| 2003/11/01 | 158.3 |
| 2003/12/01 | 157.4 |
| 2004/01/01 | 157.2 |
| 2004/02/01 | 156.6 |
| 2004/03/01 | 156.3 |
| 2004/04/01 | 156.1 |
| 2004/05/01 | 155.4 |
| 2004/06/01 | 155.9 |
| 2004/07/01 | 156.4 |
| 2004/08/01 | 156.6 |
| 2004/09/01 | 157.1 |
| 2004/10/01 | 156.5 |
| 2004/11/01 | 156.5 |
| 2004/12/01 | 157.0 |
| 2005/01/01 | 156.3 |
| 2005/02/01 | 156.3 |
| 2005/03/01 | 155.9 |
| 2005/04/01 | 156.5 |
| 2005/05/01 | 158.0 |
| 2005/06/01 | 157.4 |
| 2005/07/01 | 155.6 |
| 2005/08/01 | 157.2 |
| 2005/09/01 | 156.2 |
| 2005/10/01 | 157.9 |
| 2005/11/01 | 157.8 |
| 2005/12/01 | 157.2 |
| 2006/01/01 | 157.3 |
| 2006/02/01 | 156.4 |
| 2006/03/01 | 155.3 |
| 2006/04/01 | 156.1 |
| 2006/05/01 | 157.5 |
| 2006/06/01 | 157.1 |
| 2006/07/01 | 158.1 |
| 2006/08/01 | 156.4 |
| 2006/09/01 | 157.2 |
| 2006/10/01 | 157.5 |
| 2006/11/01 | 157.2 |
| 2006/12/01 | 158.4 |
| 2007/01/01 | 159.8 |
| 2007/02/01 | 161.5 |
| 2007/03/01 | 160.8 |
| 2007/04/01 | 162.6 |
| 2007/05/01 | 162.3 |
| 2007/06/01 | 161.1 |
| 2007/07/01 | 162.4 |
| 2007/08/01 | 161.9 |
| 2007/09/01 | 160.4 |
| 2007/10/01 | 159.6 |
| 2007/11/01 | 161.6 |
| 2007/12/01 | 161.6 |
| 2008/01/01 | 161.5 |
| 2008/02/01 | 161.3 |
| 2008/03/01 | 163.3 |
| 2008/04/01 | 162.4 |
| 2008/05/01 | 162.6 |
| 2008/06/01 | 162.4 |
| 2008/07/01 | 161.2 |
| 2008/08/01 | 160.6 |
| 2008/09/01 | 160.0 |
| 2008/10/01 | 158.2 |
| 2008/11/01 | 156.0 |
| 2008/12/01 | 152.9 |
| 2009/01/01 | 150.1 |
| 2009/02/01 | 146.0 |
| 2009/03/01 | 143.9 |
| 2009/04/01 | 136.2 |
| 2009/05/01 | 132.2 |
| 2009/06/01 | 129.8 |
| 2009/07/01 | 129.9 |
| 2009/08/01 | 129.8 |
| 2009/09/01 | 129.8 |
| 2009/10/01 | 131.3 |
| 2009/11/01 | 131.6 |
| 2009/12/01 | 132.1 |
| 2010/01/01 | 132.3 |
| 2010/02/01 | 134.4 |
| 2010/03/01 | 136.0 |
| 2010/04/01 | 138.1 |
| 2010/05/01 | 139.4 |
| 2010/06/01 | 139.7 |
| 2010/07/01 | 140.1 |
| 2010/08/01 | 140.0 |
| 2010/09/01 | 140.6 |
| 2010/10/01 | 140.3 |
| 2010/11/01 | 141.1 |
| 2010/12/01 | 141.6 |
| 2011/01/01 | 143.4 |
| 2011/02/01 | 144.5 |
| 2011/03/01 | 145.5 |
| 2011/04/01 | 148.0 |
| 2011/05/01 | 148.3 |
| 2011/06/01 | 148.8 |
| 2011/07/01 | 149.5 |
| 2011/08/01 | 149.8 |
| 2011/09/01 | 150.6 |
| 2011/10/01 | 151.4 |
| 2011/11/01 | 152.2 |
| 2011/12/01 | 152.0 |
| 2012/01/01 | 152.2 |
| 2012/02/01 | 152.6 |
| 2012/03/01 | 152.6 |
| 2012/04/01 | 151.9 |
| 2012/05/01 | 153.8 |
| 2012/06/01 | 153.3 |
| 2012/07/01 | 154.4 |
| 2012/08/01 | 152.7 |
| 2012/09/01 | 151.9 |
| 2012/10/01 | 151.9 |
| 2012/11/01 | 150.6 |
| 2012/12/01 | 150.5 |
| 2013/01/01 | 150.1 |
| 2013/02/01 | 149.0 |
| 2013/03/01 | 149.8 |
| 2013/04/01 | 149.0 |
| 2013/05/01 | 149.1 |
| 2013/06/01 | 149.1 |
| 2013/07/01 | 147.7 |
| 2013/08/01 | 149.0 |
| 2013/09/01 | 149.2 |
| 2013/10/01 | 148.3 |
| 2013/11/01 | 149.2 |
| 2013/12/01 | 150.7 |
| 2014/01/01 | 150.1 |
| 2014/02/01 | 149.8 |
| 2014/03/01 | 149.8 |
Note: Employment data combine blast furnaces and steel mills (NAICS 3311) and steel products from purchased steel (NAICS 3312).
Source: Economic Policy Institute analysis of Bureau of Labor Statistics Current Establishment Survey public data (BLS 2014)
As discussed in more detail in Section IV.B., later in this report, the domestic steel industry reorganized and restructured in the wake of the safeguard cases of 2002. The assets of numerous bankrupt steelmakers were acquired by other steelmakers. The assets of some firms were liquidated. U.S. steel production declined in 2001, but recovered over the next few years (USITC 2005). The United Steelworkers union (USW) negotiated a groundbreaking new labor agreement with major steel companies. However, as Figure L shows, about 55,000 steelworker jobs were lost between January 1999 and December 2004, a 26 percent decline in total steel employment. Most of the job losses were the result of the steel crisis and subsequent restructuring.
Although the U.S. steel industry recovered, substantial restructuring permanently reduced U.S. steel industry employment. This shows why such periodic crises in the steel industry are the gravest long-run threat to steel industry employment.
We are in another such crisis. While most of the nearly 30,000 steel industry jobs lost between 2007 and the end of 2009 due to the Great Recession were recovered by July 2012, employment trended down between mid-2012 and March 2014, the last period for which we have employment data. Recent job losses are correlated with sharp increase in imports, especially in 2012, as shown in Figure F earlier).
Between December 2013 and March 2014, 900 jobs (0.6 percent of industry employment) were lost in steel mills and steel product manufacturing (NAICS industries 3311 and 3312), as shown in Figure L. Most (700) of those jobs were lost in industries making steel products such as pipe and tube products, rebar, and wire rod, products subject to antidumping and countervailing complaints discussed in section C, below. Surging imports of unfairly trade steel products have contributed to the loss of nearly 1,000 jobs in the U.S. steel industry in the first three months of 2014 alone.
Additional evidence of the crisis in the steel industry is available in the Trade Adjustment Assistance certifications for workers who have lost their jobs due to rising U.S. imports of steel and shifts in steel production from the U.S. to other countries. (Trade Adjustment Assistance is a U.S. Department of Labor program available to workers displaced due to rising imports.) The number of certified petitions likely understates the full extent of trade-related job loss in the steel sector in recent months, as workers and companies have up to a year from the date of separation to file a petition for assistance and the Department of Labor has 60 days thereafter to make a determination. Nonetheless, the recent petitions listed in Table 1, which cover an estimated 4,184 workers in eight states, provide a snapshot of one more aspect of the crisis.
Trade Adjustment Assistance certifications for steel industry workers, 2012 through first quarter 2014
| Company and location | Product | Workers affected | Plant closing | Certification # and date |
|---|---|---|---|---|
| Evraz Claymont Steel Claymont, Del. |
Carbon plate steel | 375 | Dec. 13, 2013 | 83250 Feb. 21, 2014 |
| Republic Steel Massillon, Ohio |
Special bar quality cold finish bar | 85 | Sept. 20, 2013 | 82758 July 17, 2013 |
| AK Steel Corporation Zanesville, Ohio |
Specialty steel | 84 | Some divisions, plant unknown | 82633 Aug. 1, 2013 |
| ArecelorMittal Georgetown, S.C. |
Wire rod | 32 | No | 82482 April 4, 2013 |
| Gerdau Ameristeel US Inc. Saint Paul, Minn. |
Long steel products | 31 | No | 82373 April 1, 2013 |
| RG Steel Wheeling, LLC Wheeling, W.V. Fort Payne, Ala. |
Steel products | 2,010 | Aug. 2012 | 82342 Feb. 22, 2013 |
| U.S. Steel Tubular Products, Inc. McKeesport, Pa. |
Tubular products | 142 | Unknown | 82285 Jan. 28, 2013 |
| JMC Steel Group Sharon, Pa. |
Pipe and tube | 60–75 | Yes, unknown when | 81944 Nov. 5, 2012 |
| RG Steel Wheeling, LLC Beech Bottom, W.V. |
Roll formed metal deck | 80 | Unknown | 81879 Sep. 25, 2012 |
| RG Steel Wheeling, LLC Warren, Ohio |
Steel | 1,100 | Unknown | 81704 July 20, 2012 |
| JMC Steel Group Sharon, Pa. |
Steel pipe OCTG | 45 | June 30, 2012 | 81678 July 18, 2012 |
| Isaacson Structural Steel, Inc. Berlin, N.H. |
Structural steel | 140 | Unknown | 81251 Feb. 10, 2012 |
| Total | 4,184–4,199 |
Source: U.S. Department of Labor, Employment & Training Administration (various years)
Steelmakers have announced the potential for additional layoffs in 2014. In November of 2013, USS-POSCO warned that 690 workers could be laid off in early 2014 at its plant in Pittsburg, California, though the layoffs appear to be on hold for now (Dunn 2014). The facility produces cold-rolled steel sheets, galvanized sheets, hot-rolled pickled and oiled sheets, and tin plates. In February of 2014, U.S. Steel confirmed that layoffs would be occurring at its tubular products plant in Lorain, Ohio, but did not confirm how many workers would be affected or when the layoffs would occur (Fogarty 2014).
7. In summary
The rapid growth of excess global steel production capacity over the past decade, especially in China, but also in South Korea, India, and other major steel-exporting nations has destabilized the world steel market.
Persistent patterns of dumping, subsidies, and these unneeded capacity investments have generated falling prices and negative rates of return for steel producers in the United States. These patterns are creating a U.S. steel industry crisis that could be even worse than the downturn at the beginning of this century if action is not taken. As this section has shown, U.S. steelmakers have been hard hit by surging imports over the past two years, with U.S. steel producers absorbing $1.6 billion in losses in 2012 and 2013 alone. Steelworkers have suffered lost wages and their jobs are now at risk. If net losses in operating income continue or deepen in the next few years, a new wave of bankruptcies, layoffs, and plant closings will likely result. In this context, recent unfair trade cases take on a new importance. The next section reviews recent unfair trade cases which, taken together, collectively represent some of the most vulnerable segments of the U.S. steel industry. In return, this review sheds light on the need for effective trade remedy enforcement to enable the industry to survive the current crisis.
C. Injurious imports have spurred a wave of petitions for relief
The crisis arising from global production overcapacity and growing U.S. imports led steel producers and the United Steelworkers union to file petitions for import relief on nine products from 18 countries in 2013 and the first quarter of 2014. Counted on an individual country and product basis, there were 38 individual petitions in 2013 and another two in the first quarter of 2014.4 As Figure M shows, this is by far the largest number of petitions filed on steel imports in such a short period since the crisis which led to petitions for antidumping, countervailing duty, and safeguard relief in 2001.
U.S. antidumping and countervailing duty petitions filed on steel products, 2001–2013
| Year | Number of Steel Petitions Filed |
|---|---|
| 2001 | 55 |
| 2002 | 15 |
| 2003 | 8 |
| 2004 | 4 |
| 2005 | 3 |
| 2006 | |
| 2007 | 7 |
| 2008 | 4 |
| 2009 | 8 |
| 2010 | |
| 2011 | 11 |
| 2012 | |
| 2013 | 38 |
Source: Authors' calculations based on historical case records from the U.S. Department of Commerce and U.S. International Trade Commission.
The recent wave of petitions, though it only covers portions of the adversely affected steel industry, demonstrates the severity and breadth of the crisis. As Table 2 shows, the domestic steel companies that produce the nine products currently subject to petitions are numerous, and include both large and small companies located all over the country. Indeed, facilities producing the affected products are spread across 92 towns in 29 states. Based on publicly available information, more than 14,000 production workers were employed making these products in the United States in 2012 (USITC 2013a, 2013g, 2013h, 2014b).
Antidumping and countervailing duty petitions on steel products filed in 2013 and the first quarter of 2014
| Date filed | Case | Domestic producers | Production locations |
|---|---|---|---|
| March 27, 2013 | Diffusion-annealed, nickel-plated steel from Japan | Thomas Steel | Warren, Ohio |
| April 23, 2013 | Prestressed concrete steel rail tie wire from China, Mexico, and Thailand | Davis Insteel |
Jacksonville, Fla. Kent, Wash. |
| May 16, 2013 | Welded stainless steel pressure pipe from Malaysia, Thailand, and Vietnam | Alaskan Copper & Brass Bristol Metals Fekker Brothers Marcegaglia USA Outokumpu Rath Gibson Webco |
Clarksville, Ark. Wildwood, Fla. Glasgow, Ky. North Branch, NJ Mannford, Okla. Munhall, Pa. Bristol, Tenn. Seattle, Wash. Janesville, Wis. |
| June 27, 2013 | Steel threaded rod from India and Thailand | All America Threaded Products All Ohio Threaded Rod Co. Bay Standard Manufacturing, Inc. Interstate Threaded Products, Inc. Vulcan Threaded Products Inc. |
Pelham, Ala. Brentwood, Calif. Denver, Colo. Indianapolis, Ind. Cleveland, Ohio Lancaster, Pa. Dallas, Texas |
| July 2, 2013 | Certain oil country tubular goods from India, Korea, Philippines, Saudi Arabia, Taiwan, Thailand, Turkey, Ukraine, and Vietnam | Boomerang Tube, LLC Drill Pipe International LLC EnergeX Tube EVRAZ Rocky Mountain Steel Laguna Tubular Products Corp. Maverick Tube Corporation Northwest Pipe Company OMK Paragon Industries, Inc. Tejas Tubular Products, Inc. Texas Steel Conversion, Inc. Texas Tubular Products TMK IPSCO United States Steel Corporation Vallourec Star, LP Welded Tube USA, Inc. |
Fairfield, Ala. Thomasville, Ala. Blytheville, Ark. Hickman, Ark. Pueblo, Colo. Camanche, Iowa Wilder, Ky. Bossier City, La. New Hope, Minn. Lackawanna, N.Y. Lorain, Ohio Warren, Ohio Youngstown, Ohio Catoosa, Okla. Muskogee, Okla. Sapulpa, Okla. Ambridge, Pa. Koppel, Pa. Sharon, Pa. Baytown, Texas Bellville, Texas Bryan, Texas Conroe, Texas Houston, Texas Liberty, Texas Lone Star, Texas Stephenville, Texas |
| Sept. 4, 2013 | Steel concrete reinforcing bar from Mexico and Turkey | Alton Steel ArcelorMittal Byer Steel Cascade CMC Ervaz Gerdau Keystone Nucor SDI |
Birmingham, Ala. Magnolia, Ark. Kingman, Ariz. Mesa, Ariz. Rancho Cucamonga, Calif. Pueblo, Colo. Wallingford, Conn. Baldwin, Fla. Wilton, Iowa. Alton, Ill. Kankakee, Ill. Peoria, Ill. Pittsboro, Ind. St. Paul, Minn. Jackson, Miss. Charlotte, N.C. Sayreville, N.J. Auburn, N.Y. Cincinnati, Ohio Marion, Ohio McMinnville, Ore. Cayce, S.C. Darlington, S.C. Jackson, Tenn. Knoxville, Tenn. Canutillo, Texas Jewett, Texas Midlothian, Texas Seguin, Texas West Vidor, Texas Plymouth, Utah Roanoke, Va. Seattle, Wash. |
| Sept. 18, 2013 | Grain-oriented electrical steel from China, Czech Republic, Germany, Japan, Korea, Poland, and Russia | AK Steel Allegheny Ludlum |
West Chester, Ohio Zanesville, Ohio Brackenridge, Pa. Butler, Pa. Leechburg, Pa. |
| Sept. 30, 2013 | Non-oriented electrical steel from China, Germany, Japan, Korea, Sweden, and Taiwan | AK Steel Nucor |
Crawfordsville, Ind. Zanesville, Ohio. Butler, Pa. |
| Jan. 31, 2014 | Wire rod from China | ArcelorMittal Cascade Charter Ervaz Gerdau Keystone Mid American Nucor Republic Sterling |
Kingman, Ariz. Pueblo, Colo. Wallingford, Conn. Jacksonville, Fla. Peoria, Ill. Sterling, Ill. Chicago, Ill. Norfolk, Neb. Perth Amboy, N.J. (idled) Cuyahoga Heights, Ohio Fostoria, Ohio Lorain, Ohio Madill, Okla. McMinnville, Ore. Darlington, S.C. Georgetown, S.C. Beaumont, Texas Saukville, Wis. |
Sources: U.S. International Trade Commission (2013a, b, c, d, e, f, g, h, 2014b)
In each of the above cases, the U.S. International Trade Commission preliminarily found a reasonable indication that the domestic industry was being injured by the imports from the countries concerned. On April 17, 2014, the commission reached a negative final determination on steel threaded rod from Thailand (USITC 2014c). Final determinations in the other cases will be made later this year and in early 2015.
While many of the cases involve confidential industry information, three of the cases reveal enough public information to provide insight into the range of challenges the domestic industry and its workers are facing.
1. OCTG from nine countries
The case on oil country tubular goods from nine countries reveals how sharply conditions started to deteriorate in the beginning of 2013 (USITC 2013a). The commission’s preliminary investigation only covered the first three months of 2013. Imports from the nine countries more than doubled from 2010 to 2012. Though the quantity of imports from the nine countries fell slightly in the first quarter of 2013 as overall consumption fell, the imports were priced more aggressively and were able to increase their share of the U.S. market. The commission found that imports of OCTG from the nine countries were sold at lower prices than domestic product in the vast majority of cases, sometimes by substantial margins. Because OCTG is a highly fungible product, the pricing pressure caused the domestic industry to lose sales and forced domestic producers to lower prices to compete.
The domestic OCTG industry’s production, capacity utilization, shipments, and sales all fell in the first quarter of 2013 compared with the same period in 2012. The unit value of domestic sales also fell, by more than 10 percent compared with the first quarter of 2012. The industry was unable to cut costs as quickly as prices fell, however, and the ratio of its cost-of-goods-sold to its sales revenue rose from 77.6 percent in the first quarter of 2012 to 86.2 percent in the first quarter of 2013. As a result, the industry’s operating income for the first quarter of 2013 was slashed by nearly $191 million, or 68 percent, compared with the same period in 2012, and its operating income margin plummeted from 16 percent of sales to less than 6 percent. The more than 7,000 workers producing OCTG in the United States worked more hours but saw their total combined wages fall. Based on these trends, the U.S. International Trade Commission concluded that, “there is a reasonable indication that the large and increasing volume of subject imports had a material adverse impact on the domestic industry” (USITC 2013a).
2. Rebar from Mexico and Turkey
The bleak trends in the first quarter of 2013 described in the OCTG case persisted through the second quarter, as demonstrated in the preliminary determination on steel concrete reinforcing bar from Mexico and Turkey (USITC 2013g). In that case, the quantity of rebar from Mexico and Turkey nearly doubled from 2010 to 2012 and it rose again in the first half of 2013 compared with the first half of 2012. The unit value of those imports also fell by 8.7 percent from the first half of 2012 to the first half of 2013. As a result, importers were able to gain market share at the expense of the domestic industry. Domestic rebar producers’ production, capacity utilization, and sales were all lower in the first six months of 2013 than they had been in the same period in 2012. Just as with OCTG, rebar producers were forced to lower prices to compete but were unable to lower costs as sharply. As a result, the industry’s operating income dropped by $41 million, or 35.6 percent, and its already low operating margin of 5.4 percent in the first half of 2012 dropped to only 3.7 percent in the first half of 2013. The commission concluded that, “subject imports have had a significant adverse impact on the domestic industry.”
3. Wire rod from China
The commission’s recent preliminary determination on wire rod from China has been the first steel industry case to examine full year 2013 data (USITC 2014b). The data show that another segment of the steel industry is suffering from unfair import competition. Imports of wire rod from China were nearly nonexistent in 2011, they then jumped in 2012, and they more than doubled in volume between 2012 and 2013. Subject import unit values plummeted by more than half between 2011 and 2013, allowing Chinese wire rod to gain 14.4 points in market share while domestic producers lost 9.8 points of share. Domestic producers’ production, capacity utilization, shipments, and sales all were lower in 2013 than they had been in either 2011 or 2012. Domestic producers were forced to lower prices to compete with imports, but they were again unable to lower costs to the same degree. As a result, the industry’s operating income in 2013 was 30.5 percent lower than it had been in 2012 and less than half of what it had been in 2011. The commission noted, “Despite increases in apparent U.S. consumption, the domestic industry’s trade and financial performance declined substantially.” The industry’s operating margin fell from 6.8 percent in 2011 to just 3.6 percent in 2013. The more than 2,000 workers producing wire rod in the U.S. also suffered as employment, hours worked, and wages all fell to their lowest point in 2013.
4. In summary
The crisis in the U.S. steel industry has sparked a wave of petitions for relief from unfairly traded steel imports in 2013 and 2014. The number of petitions filed far exceeds any annual level since the previous steel crisis in 2001.
II. Why it matters: Steel’s importance and its impact on jobs
The U.S. steel industry has a large footprint in the domestic economy. Steel production has a large input-output multiplier. Each steel job supports 3.7 jobs elsewhere in the economy. And this does not include the respending effect of steel employment on the rest of the economy. Steelworkers earn good wages with excellent benefits. When they spend those wages, they support additional jobs in the economy. If jobs are lost in the steel industry, it will have a large negative impact on employment in the U.S. economy. Those effects are analyzed in this section.
A. Modeling the impacts of steel production on U.S. employment
The direct and indirect employment effects of U.S. steel production are analyzed using an input-output model of the U.S. economy. This model has been developed and calibrated by the U.S. Bureau of Labor Statistics, where it is used to develop projections of employment by industry and occupation in the U.S. economy. The modules developed include measures that estimate final demand (gross domestic product or GDP) by consuming sector and product, industry output, and employment by industry (BLS-EP 2014a).
The goal of this analysis is to estimate the total number and distribution of direct and indirect jobs supported by steel production in the United States. These jobs are at risk due to growth of excess steel production (and production capacity) in China, Korea, and other countries. Many other jobs (estimated below) have already been displaced by steel imports. Unfair trade in steel products has ignited another crisis in the steel industry which could result in further bankruptcies and reorganization or liquidation of U.S. steel capacity. No matter what becomes of U.S. steel production facilities, any major steel crisis is a direct threat to jobs supported by U.S. steel production, as was the case in the steel crisis of 1999–2003.
This analysis examines the direct effects of total steel industry output in 2012, based on data covering business establishments classified under the North American Industry Classification System (NAICS) and Bureau of Labor Statistics (BLS). The model evaluates jobs supported by total steel industry output from the two principal components of the steel industry: iron and steel mills (NAICS 3311)5, and steel products manufactured from purchased steel (NAICS 3312, and BLS industry 51). Data for real industry output was obtained from the BLS input-output matrix tables (BLS-EP 2014c).6
This analysis estimates the jobs supported directly and indirectly in the production of steel and steel products using an employment requirements table for 2012 (BLS-EP 2014b).7 Indirect jobs supported by steel production include input commodities such as minerals and ore, coke, coal and other fuels and electricity as well as services and other downstream resources consumed in the production and distribution of steel products. It does not include respending jobs supported by the wages of workers in the steel industry, or other industries supported by steel production.
B. Total jobs at risk
Table 3 shows that steel production supported 583,600 jobs in 2012. A total of 255,500 jobs supported were in manufacturing (43.8 percent of all jobs supported). The vast majority of manufacturing jobs supported were in durable goods industries (232,800; 39.9 percent). Other major sectors with substantial numbers of jobs supported included transportation and warehousing (52,100 jobs, 8.9 percent); minerals and ores (51,100 jobs, 8.8 percent); and administrative and support and waste management (56,000 jobs, 9.6 percent of jobs supported).
U.S. jobs supported by domestic steel production, by industry, 2012
| Industry | Jobs supported | Industry share of total jobs supported |
|---|---|---|
| Agriculture, forestry, fishing, and hunting | 1,100 | 0.2% |
| Mining | 55,100 | 9.4% |
| Oil and gas | 4,100 | 0.7% |
| Minerals and ores | 51,100 | 8.8% |
| Utilities | 9,400 | 1.6% |
| Construction | 8,900 | 1.5% |
| Manufacturing | 255,500 | 43.8% |
| Nondurable goods | 700 | 0.1% |
| Food | 300 | 0.1% |
| Beverage and tobacco products | 100 | 0.0% |
| Textile mills and textile product mills | 300 | 0.1% |
| Apparel | 0 | 0.0% |
| Leather and allied products | 0 | 0.0% |
| Industrial supplies | 21,900 | 3.8% |
| Wood products | 1,000 | 0.2% |
| Paper | 2,700 | 0.5% |
| Printed matter and related products | 1,300 | 0.2% |
| Petroleum and coal products | 3,900 | 0.7% |
| Chemicals | 2,400 | 0.4% |
| Plastics and rubber products | 2,900 | 0.5% |
| Nonmetallic mineral products | 7,800 | 1.3% |
| Durable goods | 232,800 | 39.9% |
| Primary metal | 176,100 | 30.2% |
| Fabricated metal products | 43,200 | 7.4% |
| Machinery | 3,500 | 0.6% |
| Computer and electronic parts | 4,500 | 0.8% |
| Computer and peripheral equipment | 200 | 0.0% |
| Communications, audio, and video equipment | 100 | 0.0% |
| Navigational, measuring, electromedical, and control instruments | 300 | 0.1% |
| Semiconductor and other electronic components, and reproducing magnetic and optical media | 3,900 | 0.7% |
| Electrical equipment, appliances, and components | 2,600 | 0.4% |
| Transportation equipment | 1,000 | 0.2% |
| Motor vehicles and motor vehicle parts | 600 | 0.1% |
| Aerospace products and parts | 100 | 0.0% |
| Railroad, ship, and other transportation equipment | 300 | 0.1% |
| Furniture and related products | 200 | 0.0% |
| Miscellaneous manufactured commodities | 1,900 | 0.3% |
| Wholesale trade | 34,500 | 5.9% |
| Retail trade | 4,000 | 0.7% |
| Transportation and warehousing | 52,100 | 8.9% |
| Information | 4,600 | 0.8% |
| Finance and insurance | 14,600 | 2.5% |
| Real estate and rental and leasing | 5,600 | 1.0% |
| Professional, scientific, and technical services | 36,500 | 6.3% |
| Management of companies and enterprises | 14,600 | 2.5% |
| Administrative and support and waste management and remediation services | 56,000 | 9.6% |
| Educational services | 300 | 0.1% |
| Health care and social assistance | 300 | 0.1% |
| Arts, entertainment, and recreation | 1,900 | 0.3% |
| Accomodation and food services | 8,800 | 1.5% |
| Other services (except public administration) | 9,700 | 1.7% |
| Public administration | 10,100 | 1.7% |
| Total | 583,600 | 100.0% |
Note: Subtotals and totals may vary due to rounding.
Sources: Economic Policy Institute analysis of U.S. Census Bureau (2013), Bureau of Labor Statistics (BLS 2013), and BLS Employment Projections program (BLS-EP 2014b and 2014c).
Up to 583,600 jobs supported by the steel industry—including the 255,500 manufacturing jobs—are clearly at risk if surging imports of unfairly traded steel are allowed to supplant or replace domestic steel production.
C. Jobs at risk by state
The jobs supported by steel production by state are shown in Table 4, which reports states ranked by the number of jobs supported. The steel jobs in these states are at risk due to surging imports of unfairly traded steel and steel products. The top 10 states in terms of number of jobs at risk were Texas (59,800 jobs supported), California (52,300 jobs), Pennsylvania (35,300 jobs), Ohio (33,900 jobs), Illinois (28,400 jobs), Indiana (26,000 jobs), New York (25,100 jobs), Florida (23,200 jobs), Michigan (20,100 jobs), and Wisconsin (15,700 jobs). The second tier (next 10) of most vulnerable states includes a number of southern and border states that are substantial producers of oil and natural gas. This group includes Georgia (14,700 jobs), North Carolina (14,000 jobs), Alabama (13,000 jobs), New Jersey (12,700 jobs), Tennessee (12,000 jobs), Virginia (11,500 jobs), Missouri (10,900 jobs), Kentucky (10,800 jobs), and Louisiana (10,500 jobs). Oklahoma and Minnesota were tied for 20th place with 10,400 jobs each. Jobs at risk by state, sorted alphabetically, are shown in Table 5.
U.S. jobs supported by domestic steel production, by state, 2012, ranked by jobs supported
| Rank | State | Jobs supported |
|---|---|---|
| 1 | Texas | 59,800 |
| 2 | California | 52,300 |
| 3 | Pennsylvania | 35,300 |
| 4 | Ohio | 33,900 |
| 5 | Illinois | 28,400 |
| 6 | Indiana | 26,000 |
| 7 | New York | 25,100 |
| 8 | Florida | 23,200 |
| 9 | Michigan | 20,100 |
| 10 | Wisconsin | 15,700 |
| 11 | Georgia | 14,700 |
| 12 | North Carolina | 14,000 |
| 13 | Alabama | 13,000 |
| 14 | New Jersey | 12,700 |
| 15 | Tennessee | 12,000 |
| 16 | Virginia | 11,500 |
| 17 | Missouri | 10,900 |
| 18 | Kentucky | 10,800 |
| 19 | Louisiana | 10,500 |
| 20 | Oklahoma | 10,400 |
| 21 | Minnesota | 10,400 |
| 22 | Washington | 9,800 |
| 23 | Colorado | 9,300 |
| 24 | Arizona | 9,300 |
| 25 | Massachusetts | 9,200 |
| 26 | South Carolina | 8,400 |
| 27 | Maryland | 8,000 |
| 28 | Iowa | 6,700 |
| 29 | Oregon | 6,300 |
| 30 | West Virginia | 6,200 |
| 31 | Arkansas | 6,200 |
| 32 | Utah | 6,000 |
| 33 | Connecticut | 5,800 |
| 34 | Kansas | 5,200 |
| 35 | Mississippi | 4,600 |
| 36 | Nevada | 3,900 |
| 37 | New Mexico | 3,500 |
| 38 | Nebraska | 3,100 |
| 39 | New Hampshire | 2,700 |
| 40 | Wyoming | 2,500 |
| 41 | Idaho | 2,400 |
| 42 | North Dakota | 1,800 |
| 43 | Montana | 1,700 |
| 44 | Maine | 1,700 |
| 45 | Alaska | 1,600 |
| 46 | Rhode Island | 1,600 |
| 47 | South Dakota | 1,400 |
| 48 | Hawaii | 1,400 |
| 49 | Delaware | 1,300 |
| 50 | Vermont | 800 |
| 51 | District of Columbia | 700 |
| Total | 583,600 |
Note: Subtotals and totals may vary due to rounding.
Sources: Economic Policy Institute analysis of U.S. Census Bureau (2013), Bureau of Labor Statistics (BLS 2013), and BLS Employment Projections program (BLS-EP 2014b and 2014c).
U.S. jobs supported by domestic steel production, by state, 2012, ranked alphabetically
| State | Jobs supported |
|---|---|
| Alabama | 13,000 |
| Alaska | 1,600 |
| Arizona | 9,300 |
| Arkansas | 6,200 |
| California | 52,300 |
| Colorado | 9,300 |
| Connecticut | 5,800 |
| Delaware | 1,300 |
| District of Columbia | 700 |
| Florida | 23,200 |
| Georgia | 14,700 |
| Hawaii | 1,400 |
| Idaho | 2,400 |
| Illinois | 28,400 |
| Indiana | 26,000 |
| Iowa | 6,700 |
| Kansas | 5,200 |
| Kentucky | 10,800 |
| Louisiana | 10,500 |
| Maine | 1,700 |
| Maryland | 8,000 |
| Massachusetts | 9,200 |
| Michigan | 20,100 |
| Minnesota | 10,400 |
| Mississippi | 4,600 |
| Missouri | 10,900 |
| Montana | 1,700 |
| Nebraska | 3,100 |
| Nevada | 3,900 |
| New Hampshire | 2,700 |
| New Jersey | 12,700 |
| New Mexico | 3,500 |
| New York | 25,100 |
| North Carolina | 14,000 |
| North Dakota | 1,800 |
| Ohio | 33,900 |
| Oklahoma | 10,400 |
| Oregon | 6,300 |
| Pennsylvania | 35,300 |
| Rhode Island | 1,600 |
| South Carolina | 8,400 |
| South Dakota | 1,400 |
| Tennessee | 12,000 |
| Texas | 59,800 |
| Utah | 6,000 |
| Vermont | 800 |
| Virginia | 11,500 |
| Washington | 9,800 |
| West Virginia | 6,200 |
| Wisconsin | 15,700 |
| Wyoming | 2,500 |
| Total | 583,600 |
Note: Subtotals and totals may vary due to rounding.
Sources: Economic Policy Institute analysis of U.S. Census Bureau (2013), Bureau of Labor Statistics (BLS 2013), and BLS Employment Projections program (BLS-EP 2014b and 2014c).
D. Jobs lost by type
Table 6 reports the direct and indirect jobs supported by U.S. steel production, and the jobs displaced by two types of steel imports: direct imports of steel and steel-using products (that is, total imports in NAICS industries 3311 and 3312), and the steel content of other manufacturing imports (such as autos, auto parts, and household appliances).
U.S. jobs supported by U.S. steel production and displaced by steel imports, 2012
| Jobs affected* | Jobs supported by domestic production | Jobs displaced by direct imports | Jobs displaced by indirect imports** | Total jobs displaced by imports (direct + indirect) |
|---|---|---|---|---|
| Direct | 123,400 | 35,600 | 26,300 | 61,800 |
| Indirect | 460,200 | 136,200 | 102,800 | 238,900 |
| Total | 583,600 | 171,800 | 129,000 | 300,800 |
*Jobs can be affected directly (in the immediate industry) and indirectly (industries that supply goods to industry of interest).
**Indirect imports refer to those imported manufacturing goods that contain steel content.
Sources: Economic Policy Institute analysis of U.S. Census Bureau (2013), Bureau of Labor Statistics (BLS 2013), and BLS Employment Projections program (BLS-EP 2014b and 2014c).
Column 1 in Table 6 shows that 123,400 direct jobs were supported by U.S. steel production in 2012, and that 460,200 jobs in other industries were supported by steel manufacturing, for a total of 583,600 jobs supported. Thus, the steel multiplier (the ratio of indirect to direct jobs supported) was 3.7.
Direct imports of semifinished and finished steel products (column 2) displaced 35,600 steel jobs in 2012, and 136,200 indirect jobs for a total of 171,800 jobs displaced by imports of steel products. It is important to note that these estimates reflect actual productivity levels in 2012. Structural changes in the steel industry have displaced hundreds of thousands of jobs over the past four decades. Many of the jobs lost were due to restructuring that was a direct response to rising imports (such as the shift from production of crude steel in open hearth or basic oxygen furnaces to finishing of crude, imported steel). Thus, Table 6 does not reflect a complete, historic accounting of all the jobs displaced by steel imports, but is, rather, a snapshot of jobs displaced by steel imports today, relative to jobs supported in remaining U.S. steel plants.
Estimates of jobs displaced due to indirect steel imports (column 3) are based on a first-order estimate of the steel content of U.S. manufacturing imports in 2012. This estimate shows that imports of manufactured goods that contain steel content displaced an additional 26,300 jobs in U.S. steel production (the direct jobs lost) and 102,800 jobs in industries supported by the steel industry, for a total of 129,000 jobs displaced by indirect imports.
The indirect estimate only reflects the direct steel content of imported manufactured products, and does not include a full, input-output-based assessment of domestic production displaced by imports. Thus, for example, it includes the direct steel displaced by auto imports, but does not include steel used in the manufacture of auto bodies or engines.8
The American Iron and Steel Institute (2013) has estimated the total steel content of U.S. manufacturing imports for 2008–2012. The institute reports that in every year, total steel embodied in “indirect steel product imports” exceeded the level of direct steel imports. In 2012, for example, the U.S. had 25.8 million net tons of total steel imports, and 42.0 million net tons of indirect steel product imports, for a total of 67.8 million net tons. Indirect imports represented 62 percent of total steel imports in that year (American Iron and Steel Institute 2013, 9).
E. The vital role of steel in the U.S. economy
Steel is a vital input in a wide range of manufactured products including autos and auto parts, machine tools, architectural and structural metals manufacturing, forging, foundries, ventilation, heating and air conditioning equipment, household appliances, and many more. In fact, most durable goods manufacturing industries are major direct or indirect consumers of steel products.9 If domestic steel production declines precipitously, domestic production in these steel-consuming industries could follow, leading to massive job losses in manufacturing, and the industries supported by manufacturing output.
In addition to the jobs lost, surging imports of unfairly traded steel supplanting domestic steel production would also reduce connections between steelmakers and steel-consuming sectors, connections which are critical to ongoing innovations in both steel and downstream, steel-using industries. Giving up some or all of the domestic steel industry would reduce the capacity of a critical “industrial commons” that is a key input to many manufacturers, especially in durable goods industries (Shih and Pisano 2009). This would directly reduce the ability of a wide range of manufacturers to engage in continuous innovations in tandem with steelmakers located near their facilities.
Maintaining a viable domestic steel industry is also critical for U.S. national security. Steel is essential to the construction and maintenance of manufacturing supply chains (roads, bridges, airports, rail lines, and shipping facilities), and of military and related vehicles and equipment, including rails, rail cars, ground vehicles, tanks, ships, and military bases at home and abroad.
Maintaining a secure energy infrastructure also requires having a stable, reliable source of domestic steel for petroleum refineries, oil and gas pipelines, storage tanks, electric power plants, and the transmission and distribution grids. All of these require having a reliable, economic source of high-quality steel. Some military equipment, in particular, requires high-strength specialty steel capable of resisting bomb blasts and missile attacks.
Increased reliance on foreign sources of supply would expose the domestic industrial base, and military supply chains in particular, to: 1) poor manufacturing processes in offshore facilities; 2) natural disasters, domestic unrest, changes in government and political disputes that could “cut or halt production and exports at foreign factories”; and 3) foreign suppliers who sharply raise prices or restrict production or exports once they have taken control of most or all of the global supply of crucial steel products (Adams 2013, ii).
Several of the risks of creating dependencies on foreign suppliers of critical materials are illustrated by the case of China’s restrictions on rare earth exports (Scott 2012b). The United States used to be self-sufficient in most rare earth metals, which are used widely in computer and electronics and battery manufacturing, and many other critical applications. Over the past 15 years, the U.S. became 100 percent dependent on imports, mostly from China (Humphries 2013). China has restricted exports and raised export prices, which has raised the cost of production for manufacturers in a wide range of industries.
Steel is used in a much wider range of industrial applications than rare earth metals, critical though they are for many high-tech industries. If foreign suppliers are allowed to supplant domestic steel production, not only are nearly 600,000 jobs in steel and industries supported by steel at risk, but a much broader range of steel-using industries could be threatened by a proliferation of low-quality inputs and supply chain disruptions. The ability of steel-using industries to innovate could also be threatened. Lastly, loss of the U.S. steel production base could increase the vulnerability of U.S. manufacturing to supply disruptions and to predatory practices in steel and a wide range of steel-using industries.
III. Causes of the steel import crisis
The import crisis in the U.S. steel industry stems from a number of causes. Aggressive government support for steelmakers in other countries leads to capacity additions not driven by economic fundamentals, and those government-backed steelmakers are loath to reduce production and capacity when demand collapses. The high capital intensity of the industry leads producers to maximize production to cover fixed costs, and this in turn leads them to dump excess production on foreign markets—particularly the attractive U.S. market—when domestic demand lags. This has led to repeated surges in unfairly traded steel over the years. In addition, the more recent integration of global supply chains has permitted China to increase not only its direct exports to the U.S. but also its exports to third countries that then further process steel for eventual export to the U.S. and elsewhere. Finally, the slow economic recovery has suppressed demand for steel in the United States and increased the vulnerability of domestic producers to surges of dumped and subsidized imports of steel and steel products.
A. State support for the steel industry
As detailed in Section I.A, the global steel industry is currently suffering a glut in production overcapacity that is plunging the industry into its worst financial performance since the Asian financial crisis and its aftermath in the late 1990s and early 2000s. Unfortunately, the current crisis is just the latest in a pattern the industry has endured for decades.
A major reason for overcapacity in the steel sector is strong government support for steel in countries around the world.
Some have attributed the increasing government involvement in the steel sector, starting in Europe in the 1970s, to the growing scale of integrated steelworks, the capital requirements of which in some cases could only be met by very well-financed entities or, in the absence of such private entities, the state (Howell et al. 1988). Starting in 1974, these policies, combined with stagnant consumption, led to increases in capacity that outpaced increases in consumption. By 1982, governments owned 55 percent of global steelmaking capacity, with higher rates of government ownership outside of Japan and the United States (ibid.).
Strong government support for, and involvement in, the steel sector has since spread to other countries, and intensified in China and other Asian nations in particular. In 2011, half of the world’s 46 top steel companies were state-owned enterprises, and these state-owned enterprises generated 38 percent of the world’s steel production (Rubio 2013). In 2012, six of the world’s 10 largest steelmakers were headquartered in China, where state-owned producers dominate production (World Steel Association 2012).
China’s aggressive support for its steel producers has been a particular source of concern. The steel industry is designated as a pillar industry in China, and it has also been identified as one of the industries in which China intends to have the state continue to play a leading role. In its 12th Five Year Plan, which sets the Chinese government’s economic development priorities for 2011 through 2015, the government aimed to restrict steel capacity expansions, but it also sought to encourage mergers to create larger steel companies and to move the industry up the value chain (KPMG 2011). A 2012 article reports that the goals of consolidation and focusing on higher-value products were thwarting attempts to restrict capacity expansions, as smaller mills invested in expansions (with local government support) to avoid becoming merger targets and as a sudden glut in high-end products reduced firms’ profitability, leading firms to lean on additional government support to cover costs (Stanway and Lian 2012).
The U.S. Department of Commerce has documented a wide range of subsidies that the government of China provides to its steel industry, including preferential tax treatment, low-cost loans from government-owned banks, debt forgiveness, and grants (DOC various years). The government of China also provides steel producers with land use rights, electricity, and numerous steel inputs at below-market prices. The department has also found that China’s export restraints on coke provide subsidy benefits to Chinese steel producers—these and other export restraints are discussed in more detail below.
China is not alone in providing strong state support to the steel industry. Over the years, the U.S. Department of Commerce has identified a range of subsidies that other governments provide to their steel producers, including the following:
- The Indian government has provided government loans, debt forgiveness, and various export subsidies to steel producers. The government of India has also provided iron ore to steel producers at below-market prices.
- The government of South Korea has provided debt restructuring, directed credit, and grants to steel companies, as well as exemptions from harbor fees, bond requirements, and value-added taxes (VATs). The government of South Korea has also provided direct equity infusions and investments in dedicated infrastructure, discounted land, and steel inputs at below-market prices.
- The Turkish government has provided steel producers with duty and tax exemptions, deductions, and rebates; VAT and freight rebates; export credits; and foreign-exchange loan assistance.
- The government of Brazil has provided preferential loans to steel producers, as well as tax and duty exemptions and rebates. The Brazilian government has also supported steel producers through equity infusions, debt-for-equity swaps, and the provision of dedicated infrastructure.
Many governments also support their steel industry by imposing export restraints on critical inputs to steelmaking. The OECD has documented more than 1,600 export-restraint measures—including export taxes, export licenses, export quotas, and other restraints—maintained by 100 countries (Fliss and Mård 2012). As the OECD found, “The practice of regulating exports of waste and scrap of metals (ferrous and non-ferrous) appears to be widespread. Export measures are also relatively common in the iron and steel sector and for certain materials needed for the production of steel ….” Indeed, 46 percent of the measures identified in 2010 concerned waste and scrap metal. Among the rationales countries cited for these measures were “safeguarding domestic supply” and “protecting the local industry.”
In June of 2009, the United States, the European Union, and Mexico brought dispute settlement cases at the World Trade Organization (WTO) regarding China’s export restraints on a group of raw materials used in the steel industry among other downstream industries. The restraints artificially increase input supplies for steel producers in China and lower their input prices, while lowering supply and increasing input prices for steel producers outside of China. In January of 2012, the WTO Appellate Body found that export duties and quotas on these raw materials violated China’s WTO obligations. While China brought itself into compliance with the WTO decision regarding the materials covered in that case, it continues to maintain restraints on hundreds of additional items that are plainly inconsistent with its WTO obligations. The U.S. and other countries brought another case against China on a subset of these materials, including the rare earth metals cited above, and have achieved an initial victory in that case. There have been no formal dispute settlement actions taken to address the export restraints maintained by other countries to support their steel producers.
In conclusion, states have invested heavily in their steel industries for many policy reasons, including national security, economic development, and employment. With years of state investment and support on the line, governments have been loath to reduce their levels of support, much less take inefficient or outdated capacity out of production, when demand declines. This has been the case even when faced with major shocks such as the 2008 financial crisis and its aftermath. The result is structural overcapacity that leads to surges in exports when demand cannot keep up with state-backed capacity additions.
B. Foreign producers with high fixed costs
The high fixed costs and capital intensity of steelmaking require a high capacity utilization rate for the industry to remain viable.10 A capacity utilization rate of around 92 percent is considered healthy for the industry (Boston Consulting Group 2002). The steel industry also has significant economies of scale, such that integrated facilities must be quite large to reach a minimum efficient scale (CEPS and EA 2013). The high capital requirements, capital intensity, and large scale of steel operations combine to create significant barriers to exit in the industry, as there are high costs to converting facilities to another use, reducing production volumes, or abandoning facilities altogether (ibid.). The government support policies detailed above make it even more difficult to make rational alterations to production and take capacity off-line when demand stagnates.
To avoid the very costly alternatives of reduced production or even closure, when demand falls foreign steel producers continue to produce at high volumes in order to maximize capacity utilization and spread high fixed costs over the highest volume possible:
When fixed costs are high, it makes sense for struggling steel firms to continue running their plants so long as the marginal revenues from extra production at least cover variable costs. Economic logic at the firm level ensures depressed prices – and widespread operating losses – at the industry level. (Hufbauer and Goodrich 2001)
When domestic demand is insufficient to absorb this production, the incentive is for steel producers to export their excess production, even at prices that are too low to cover their aggregate costs of production, in order to maintain higher rates of capacity utilization. The result, particularly where producers are fragmented or do not operate based on market principles, is an increase in exports at dumped prices. When the industry suffers global demand shocks such as the 1998 Asian financial crisis or the 2008 financial crisis, it only multiplies the number of producers around the world with the incentive to dump their way out of the crisis, further exacerbating the glut of low-priced steel being exported from markets around the world.
Heavy government support for and involvement in the global steel industry, combined with incentives to export dumped steel in times of economic downturn, make the steel industry structurally vulnerable to repeated surges in exports of unfairly traded steel. Historical data on the use of trade remedies in the steel sector confirm this conclusion.
According to the WTO, 29 percent of all antidumping measures imposed by WTO members between 1995 and June of 2013 were on base metals and articles, which include steel products (WTO 2013b). This is the most of any of the sectors tracked by the WTO to categorize trade remedy actions, and only the chemicals sector (another highly capital-intensive industry) comes close, at 21 percent. Base metals and articles made up an even higher portion of all countervailing duty measures imposed by WTO members during the period, accounting for 47 percent of all such measures (WTO 2013d).
The WTO’s data on antidumping and countervailing duty initiations by year and by sector, shown in Figure N, demonstrate the repeated pattern of surges in unfairly traded steel, with initiations increasing during periods of global economic distress such as the 1998 Asian financial crisis and the 2008 financial crisis and their aftermaths. In 2012, the number of initiations on base metals and articles reached its highest level since 2002, and the number of initiations increased again in 2013. The pattern of repeated surges (and thus repeated need to rely on trade remedies) confirms that the cause of the surges is not merely temporal but structural in nature, due in large part to the active involvement of foreign governments in their steel industries.
WTO member initiations of antidumping and countervailing duty investigations on base metals and articles, 1995–2013
| Year | Antidumping | Countervailing duty |
|---|---|---|
| 1995 | 43 | 0 |
| 1996 | 39 | 0 |
| 1997 | 64 | 7 |
| 1998 | 111 | 12 |
| 1999 | 111 | 20 |
| 2000 | 109 | 11 |
| 2001 | 137 | 14 |
| 2002 | 96 | 1 |
| 2003 | 53 | 3 |
| 2004 | 38 | 3 |
| 2005 | 39 | 0 |
| 2006 | 31 | 2 |
| 2007 | 24 | 3 |
| 2008 | 70 | 7 |
| 2009 | 52 | 11 |
| 2010 | 43 | 4 |
| 2011 | 58 | 10 |
| 2012 | 76 | 11 |
| 2013 | 81 | 12 |
Note: Figure includes cases initiated by all 150 member countries of the WTO 1995–2013.
Sources: World Trade Organization (various years [antidumping and countervailing duty], 2013a, 2013c)
The U.S. market, with its large size and open-market conditions, is a prime target for steel exports when the global industry enters a crisis period. Figure O compares U.S. imports of semifinished and finished steel from 1990 to 2012 to the rest of the world’s imports of semifinished and finished steel during the same period.
U.S. and rest-of-world imports of semifinished and finished steel, 1990–2012
| Year | U.S. Imports | Rest-of-world imports |
|---|---|---|
| 1990 | 15.8 | 150.904 |
| 1991 | 14.589 | 153.843 |
| 1992 | 15.674 | 164.431 |
| 1993 | 17.904 | 197.071 |
| 1994 | 27.526 | 206.819 |
| 1995 | 22.432 | 214.231 |
| 1996 | 26.649 | 201.849 |
| 1997 | 28.471 | 220.968 |
| 1998 | 37.948 | 217.58 |
| 1999 | 32.735 | 232.258 |
| 2000 | 34.754 | 263.744 |
| 2001 | 27.793 | 264.207 |
| 2002 | 30.157 | 279.904 |
| 2003 | 21.631 | 310.893 |
| 2004 | 32.752 | 329.738 |
| 2005 | 30.187 | 333.369 |
| 2006 | 42.192 | 368.664 |
| 2007 | 27.683 | 401.088 |
| 2008 | 24.637 | 401.767 |
| 2009 | 15.342 | 313.335 |
| 2010 | 22.51 | 362 |
| 2011 | 26.59 | 379.168 |
| 2012 | 30.886 | 372.19 |
Sources: International Iron and Steel Institute (2000, 2003); World Steel Association (2013b)
As Figure O shows, during the Asian financial crisis, U.S. imports of semifinished and finished steel products spiked much more sharply than other countries’ imports. While U.S. imports also rose in the mid-2000s, this was related to increases in domestic demand rather than targeting of excess production during a global downturn. Since the depths of the financial crisis in 2009, U.S. imports have again surged more sharply than imports in the rest of the world, with annual U.S. imports more than doubling from 2009 to 2012. The sharp peaks in U.S. imports during times of global crisis confirm that the U.S. is the export market of choice when the global industry is saddled with excess capacity, as it is today.
A comparison with European imports confirms the unique attractiveness of the United States as the market of last resort for foreign steelmakers struggling with oversupply. While U.S. imports jumped by 33 percent from 1997 to 1998 as the Asian financial crisis hit, Europe’s imports rose by only 13 percent. In addition, while U.S. imports more than doubled during the most recent crisis from 2009 to 2012, Europe’s imports grew by only 22 percent. (International Iron and Steel Institute 2000 and 2003; World Steel Association 2013b)
As the U.S. market has been repeatedly targeted with dumped and subsidized steel exports, U.S. producers have repeatedly been forced to rely on trade remedies to survive.
Figure P illustrates the number of antidumping and countervailing duty petitions filed in the U.S. on steel products each year since 1980. It is important to note that Figure P only includes antidumping and countervailing duty petitions; it does not include safeguard petitions, voluntary restraint agreements, or other measures. Voluntary restraint agreements with Europe and many other countries limited the quantity of U.S. steel imports between October 1, 1984 and March 31, 1992 (USITC 1995). Safeguard duties and quotas were also imposed on certain steel imports from March 20, 2002 through December of 2003 (USITC 2005). These latter remedies do not address unfair trade practices such as dumping and subsidies; instead, they address import surges resulting from structural overcapacity among producers in dozens of countries.
U.S. antidumping and countervailing duty petitions filed on steel products, 1980–2013
| Year | Antidumping | Countervailing duty |
|---|---|---|
| 1980 | 8 | 0 |
| 1981 | 2 | 3 |
| 1982 | 46 | 97 |
| 1983 | 14 | 4 |
| 1984 | 50 | 17 |
| 1985 | 24 | 14 |
| 1986 | 9 | 2 |
| 1987 | 2 | 0 |
| 1988 | 4 | 1 |
| 1989 | 0 | 0 |
| 1990 | 7 | 2 |
| 1991 | 11 | 1 |
| 1992 | 65 | 40 |
| 1993 | 13 | 1 |
| 1994 | 23 | 6 |
| 1995 | 4 | 0 |
| 1996 | 5 | 0 |
| 1997 | 11 | 5 |
| 1998 | 23 | 8 |
| 1999 | 35 | 11 |
| 2000 | 36 | 6 |
| 2001 | 46 | 9 |
| 2002 | 14 | 1 |
| 2003 | 7 | 1 |
| 2004 | 4 | 0 |
| 2005 | 3 | 0 |
| 2006 | 0 | 0 |
| 2007 | 5 | 2 |
| 2008 | 2 | 2 |
| 2009 | 4 | 4 |
| 2010 | 0 | 0 |
| 2011 | 6 | 5 |
| 2012 | 0 | 0 |
| 2013 | 28 | 10 |
Source: Authors' calculations based on historical case records from the U.S. Department of Commerce and U.S. International Trade Commission
The historical U.S. case statistics confirm that the pattern seen in WTO member initiations since 1995 is not a recent anomaly. The steel industry is susceptible to structural overcapacity due to strong state support in numerous countries, which leads to uneconomic behavior. When demand collapses, imports surge and the industry enters into crisis, leading to a need to rely on effective trade remedies to obtain relief. The very sharp increase in new petitions filed in 2013 confirms that the U.S. steel industry is again in another such crisis.
C. Growth in global supply chains
The growth in excess steel production capacity and global supply chain integration has also resulted in the diffusion of unfairly traded steel products in ways that cannot be fully addressed under existing antidumping and countervailing duty laws.
As shown in Figure B, earlier, the steel industry is susceptible to structural production overcapacity, which has resulted in the imposition of antidumping and countervailing duties on a number of steel products. Unfortunately, the growth of globally integrated steel supply chains has permitted some foreign producers to continue exporting unfairly traded product to the U.S. by sending that product through third countries for further processing before export.
For example, in 2001, hot-rolled, flat-rolled carbon steel products from China, India, Indonesia, Taiwan, and Thailand were assessed with antidumping duties which have since remained in place (U.S. International Trade Commission 2014a).11 Many subsequent unfair trade cases were brought against products that could be manufactured from hot-rolled carbon steel and other upstream products that are also subject to antidumping and countervailing duties, such as carbon steel plate. For example, antidumping and countervailing duties were assessed on circular welded carbon pipe from China in July 2008, light-walled rectangular tubing in August 2008, circular welded carbon quality line steel pipe in January 2009, circular welded stainless pressure pipe in March 2009, oil country tubular goods in 2010, and drill pipe and collars in March 2011 (USITC 2014a).12
When unfairly traded steel products from one country are removed from the market, there is a widespread tendency for the production of such goods to shift to other markets not subject to dumping or countervailing duties (for those products). This often results in new antidumping cases. For example, in OCTG, the USITC (2013a) issued an affirmative preliminary determination against imports of such products from India, Korea, the Philippines, Saudi Arabia, Taiwan, Thailand, Turkey, Ukraine, and Vietnam.
U.S. unfair trade laws have not kept pace with structural changes in the global economy. The concept of global supply chains was not yet part of the business or economic vocabulary in 1998. Global supply chains allow dumped or subsidized upstream inputs, such as steel sheet, strip, or plate, to be transported to third countries and used to produce downstream products such as OCTG or rectangular tubing.
The U.S. Commerce Department is not allowed to assess duties on the unfairly traded inputs of downstream products made with dumped or subsidized imported inputs except in some very narrowly defined anticircumvention cases. This has exposed domestic producers to unfair competition for which no remedies are available. This is an important issue for future policy consideration that is addressed in section IV in this report.
Export data illustrate this “global supply chain problem” (namely China, sending dumped and/or subsidized content into the U.S. tariff-free by embedding it in downstream products from other countries). The growth in exports of finished and semifinished steel from China and South Korea between 2003 and 2012 led export growth of all other producers combined, as shown in Figure Q. Together, the increase in exports from China and South Korea accounted for more than three-fourths (a total of 62.7 million metric tons, 77.9 percent) of the growth in global steel exports in this period.
Growth in exports of finished and semifinished steel by producing country/region, 2003–2012
| Country/region | Change (millions of metric tons) |
|---|---|
| China | 46.5 |
| South Korea | 16.1 |
| European Union | 8.7 |
| Other Europe | 8.0 |
| Japan | 7.7 |
| U.S. | 5.8 |
| India | 3.2 |
| Taiwan | 0.8 |
| Other Asia | 0.1 |
| Other North America | 0.0 |
| Oceania | -0.1 |
| Middle East | -1.5 |
| Russia | -1.6 |
| Ukraine | -2.4 |
| Other South America | -2.6 |
| Brazil | -3.2 |
| Africa | -4.2 |
Source: Economic Policy Institute analysis of World Steel Association (2013b)
Exports of steel from China more than quadrupled between 2003 and 2012, an increase of 46.5 million metric tons (564.8 percent). South Korea was already one of the largest steel exporters in the world in 2003, second only to Japan. Korea’s steel exports more than doubled between 2003 and 2012, a striking increase of 16.1 million metric tons (114.5 percent), second only to those of China.
Other countries/regions experiencing substantial growth in total exports in this period included the European Union (8.7 million metric tons), Other Europe (8.0 million metric tons), Japan (7.7 million metric tons), India (3.2 million metric tons), and Taiwan (0.8 million metric tons). Turkey (not shown) was the largest exporter by far in “other Europe.” Turkey’s exports increased 7.5 million metric tons between 2003 and 2012, ranking it just behind the entire EU, and well ahead of the United States. Turkey has become a significant player in world steel export markets.
During this period, China went from being the largest net importer of finished and semifinished steel products to the largest net exporter in the world, and its net exports increased 75.6 million metric tons between 2003 and 2012, as shown in Figure R.
Growth in net exports of finished and semifinished steel by producing country/region, 2003–2012
| Country/region | Change (millions of metric tons) |
|---|---|
| China | 75.6 |
| South Korea | 11.4 |
| Japan | 5.3 |
| European Union | 4.9 |
| Taiwan | 4.4 |
| Other Europe | 4.0 |
| Oceania | -1.1 |
| U.S. | -3.4 |
| Ukraine | -3.5 |
| India | -4.1 |
| Russia | -5.1 |
| Brazil | -6.5 |
| Other North America | -6.7 |
| Other South America | -8.5 |
| Middle East | -13.9 |
| Africa | -14.2 |
| Other Asia | -23.9 |
Source: Economic Policy Institute analysis of World Steel Association (2013b)
South Korea had the second-fastest growth in net exports, with a net increase of 11.4 million metric tons between 2003 and 2012. Korea was also transformed from a net steel importer (-1.6 million metric tons) in 2003 to a net exporter of 9.8 million metric tons in 2012. China and Korea lead all other countries in the growth of net steel exports. Other countries/regions experiencing significant net export growth included Japan (5.3 million metric tons), the European Union (4.9 million metric tons), Taiwan (4.4 million metric tons), and other Europe (4.0 million metric tons). Turkey (not shown) was the most significant net exporter in other Europe; Turkey’s net exports of finished and semifinished steel increased 4.2 million metric tons in this period.
More evidence of the “global supply chain problem” (namely China sending dumped and/or subsidized content into the U.S. tariff-free by embedding it in downstream products from other countries) can be found in data on third-country imports of Chinese steel. China is the world’s largest net exporter of steel products.13 Figure S reports imports of steel and steel products from China by four major steel exporters: South Korea, Japan, the Russian Federation, and Turkey. The data cover 2009 through 2012, and are expressed in billions of U.S. dollars, rather than metric or net tons, because quantity data were not available for this analysis. If average unit values (AUVs) of steel imports were falling in these countries, as they did in the United States in the later parts of this period, then dollar values may tend to understate the growth in imports, especially in 2011 and 2012.
Major steel exporters' imports of finished and semifinished steel from China, 2009–2012
| Year | South Korea | Japan | Russian Federation | Turkey |
|---|---|---|---|---|
| 2009 | 7.1 | 3.5 | 0.9 | 0.6 |
| 2010 | 9.6 | 4.6 | 2.0 | 0.9 |
| 2011 | 12.5 | 6.3 | 2.5 | 1.0 |
| 2012 | 11.4 | 5.7 | 2.4 | 0.9 |
Source: Economic Policy Institute analysis of United Nations Comtrade Database (UN 2014)
South Korea was by far the largest importer of Chinese steel products, and its imports rose sharply from 2009 to 2012. This may reflect its proximity to China, and also the rapid rate of growth of its exports. Japan was the second-largest recipient of Chinese steel in this sample, and its annual imports, which were half or less than half those of Korea, also grew rapidly over the period. Imports of steel from China by the Russian Federation and by Turkey also increased over this period, though by much smaller amounts.
Although not shown in the figure, the growth of steel exports from Korea between 2009 and 2012 was second only to China’s steel export growth in all the world. Korean steel exports increased 10 million metric tons (49.4 percent) in this period (versus 30.8 million metric tons for China). Japan’s steel exports increased 8.2 million metric tons (24.5 percent). During the 2009–2012 period, trade was suppressed by the Great Recession, and did recover sharply, along with production and domestic steel consumption in most countries.
These data provide a preliminary glimpse into patterns of growth in the global steel supply chains. They do suggest that trade in intermediate steel products, some of which are subject to antidumping and countervailing duties in the United States and other countries, is facilitating circumvention of those duties when unfairly traded upstream products are incorporated into downstream products in other countries. Such indirect trade is likely damaging U.S. producers of the like products in these cases, and is injuring U.S. steel producers and steelworkers by leading to increased imports of dumped and subsidized products that are not being fully addressed due to gaps in U.S. unfair trade laws.
Taken together, these data also show that steel producers in China and South Korea may be teaming up to maximize joint steel exports. China’s steel exports to Korea appear to be a major driving force behind the growth of Korean exports to the rest of the world.
D. Slow recovery
The slow recovery from the Great Recession has increased the U.S. steel industry’s vulnerability to unfair competition. As shown earlier in Figure I, domestic steel shipment levels have not returned to where they were in the last recovery, when net shipments averaged 107.7 million net tons per year between 2003 and 2007. Furthermore, domestic producers have experienced net income losses in four of the past five years (Figure J).
Recovery from the Great Recession has been much slower than from preceding recessions. Overall manufacturing output has yet to reach its prerecession level, as shown in Figure T. Manufacturing output increased 4.8 percent per year between September 1990 and July 2000 (business cycle peaks), but growth in manufacturing since has slowed dramatically. The manufacturing sector is a major consumer of steel products (the steel output also depends on the growth in the auto sector, domestic construction, defense spending, and domestic oil and gas drilling and production, as well as export demand).
U.S. manufacturing production, 1986–2014
| Month | Value-added production index of manufacturing industry |
|---|---|
| 1986/01/01 | 49.9 |
| 1986/02/01 | 49.7 |
| 1986/03/01 | 49.5 |
| 1986/04/01 | 49.6 |
| 1986/05/01 | 49.7 |
| 1986/06/01 | 49.5 |
| 1986/07/01 | 49.8 |
| 1986/08/01 | 49.9 |
| 1986/09/01 | 50.1 |
| 1986/10/01 | 50.2 |
| 1986/11/01 | 50.5 |
| 1986/12/01 | 50.9 |
| 1987/01/01 | 50.8 |
| 1987/02/01 | 51.5 |
| 1987/03/01 | 51.5 |
| 1987/04/01 | 51.8 |
| 1987/05/01 | 52.2 |
| 1987/06/01 | 52.4 |
| 1987/07/01 | 52.8 |
| 1987/08/01 | 53.1 |
| 1987/09/01 | 53.4 |
| 1987/10/01 | 54.3 |
| 1987/11/01 | 54.6 |
| 1987/12/01 | 55.0 |
| 1988/01/01 | 54.9 |
| 1988/02/01 | 55.0 |
| 1988/03/01 | 55.2 |
| 1988/04/01 | 55.7 |
| 1988/05/01 | 55.6 |
| 1988/06/01 | 55.8 |
| 1988/07/01 | 55.8 |
| 1988/08/01 | 55.8 |
| 1988/09/01 | 56.0 |
| 1988/10/01 | 56.3 |
| 1988/11/01 | 56.4 |
| 1988/12/01 | 56.7 |
| 1989/01/01 | 57.2 |
| 1989/02/01 | 56.6 |
| 1989/03/01 | 56.5 |
| 1989/04/01 | 56.7 |
| 1989/05/01 | 56.1 |
| 1989/06/01 | 56.3 |
| 1989/07/01 | 55.6 |
| 1989/08/01 | 56.2 |
| 1989/09/01 | 56.0 |
| 1989/10/01 | 55.9 |
| 1989/11/01 | 56.0 |
| 1989/12/01 | 56.1 |
| 1990/01/01 | 55.9 |
| 1990/02/01 | 56.8 |
| 1990/03/01 | 57.1 |
| 1990/04/01 | 56.9 |
| 1990/05/01 | 57.0 |
| 1990/06/01 | 57.2 |
| 1990/07/01 | 57.1 |
| 1990/08/01 | 57.3 |
| 1990/09/01 | 57.3 |
| 1990/10/01 | 56.8 |
| 1990/11/01 | 56.2 |
| 1990/12/01 | 55.7 |
| 1991/01/01 | 55.3 |
| 1991/02/01 | 54.9 |
| 1991/03/01 | 54.6 |
| 1991/04/01 | 54.8 |
| 1991/05/01 | 55.2 |
| 1991/06/01 | 55.8 |
| 1991/07/01 | 56.0 |
| 1991/08/01 | 56.1 |
| 1991/09/01 | 56.7 |
| 1991/10/01 | 56.6 |
| 1991/11/01 | 56.5 |
| 1991/12/01 | 56.4 |
| 1992/01/01 | 56.0 |
| 1992/02/01 | 56.6 |
| 1992/03/01 | 57.2 |
| 1992/04/01 | 57.5 |
| 1992/05/01 | 57.8 |
| 1992/06/01 | 58.0 |
| 1992/07/01 | 58.5 |
| 1992/08/01 | 58.3 |
| 1992/09/01 | 58.4 |
| 1992/10/01 | 58.8 |
| 1992/11/01 | 59.0 |
| 1992/12/01 | 58.9 |
| 1993/01/01 | 59.5 |
| 1993/02/01 | 59.6 |
| 1993/03/01 | 59.5 |
| 1993/04/01 | 59.8 |
| 1993/05/01 | 59.8 |
| 1993/06/01 | 59.6 |
| 1993/07/01 | 59.8 |
| 1993/08/01 | 59.7 |
| 1993/09/01 | 60.1 |
| 1993/10/01 | 60.7 |
| 1993/11/01 | 60.9 |
| 1993/12/01 | 61.3 |
| 1994/01/01 | 61.4 |
| 1994/02/01 | 61.5 |
| 1994/03/01 | 62.3 |
| 1994/04/01 | 62.9 |
| 1994/05/01 | 63.3 |
| 1994/06/01 | 63.6 |
| 1994/07/01 | 63.9 |
| 1994/08/01 | 64.4 |
| 1994/09/01 | 64.6 |
| 1994/10/01 | 65.3 |
| 1994/11/01 | 65.8 |
| 1994/12/01 | 66.6 |
| 1995/01/01 | 66.7 |
| 1995/02/01 | 66.6 |
| 1995/03/01 | 66.7 |
| 1995/04/01 | 66.7 |
| 1995/05/01 | 66.8 |
| 1995/06/01 | 67.1 |
| 1995/07/01 | 66.7 |
| 1995/08/01 | 67.5 |
| 1995/09/01 | 68.1 |
| 1995/10/01 | 68.1 |
| 1995/11/01 | 68.2 |
| 1995/12/01 | 68.5 |
| 1996/01/01 | 67.9 |
| 1996/02/01 | 69.0 |
| 1996/03/01 | 68.9 |
| 1996/04/01 | 69.6 |
| 1996/05/01 | 70.2 |
| 1996/06/01 | 70.9 |
| 1996/07/01 | 71.1 |
| 1996/08/01 | 71.5 |
| 1996/09/01 | 72.1 |
| 1996/10/01 | 71.9 |
| 1996/11/01 | 72.5 |
| 1996/12/01 | 73.1 |
| 1997/01/01 | 73.2 |
| 1997/02/01 | 74.2 |
| 1997/03/01 | 75.1 |
| 1997/04/01 | 74.9 |
| 1997/05/01 | 75.5 |
| 1997/06/01 | 76.0 |
| 1997/07/01 | 76.6 |
| 1997/08/01 | 77.6 |
| 1997/09/01 | 78.2 |
| 1997/10/01 | 78.9 |
| 1997/11/01 | 79.8 |
| 1997/12/01 | 80.2 |
| 1998/01/01 | 80.9 |
| 1998/02/01 | 80.9 |
| 1998/03/01 | 80.8 |
| 1998/04/01 | 81.1 |
| 1998/05/01 | 81.5 |
| 1998/06/01 | 80.9 |
| 1998/07/01 | 80.4 |
| 1998/08/01 | 82.5 |
| 1998/09/01 | 82.3 |
| 1998/10/01 | 83.1 |
| 1998/11/01 | 83.2 |
| 1998/12/01 | 83.7 |
| 1999/01/01 | 84.0 |
| 1999/02/01 | 84.7 |
| 1999/03/01 | 84.6 |
| 1999/04/01 | 84.9 |
| 1999/05/01 | 85.7 |
| 1999/06/01 | 85.5 |
| 1999/07/01 | 85.9 |
| 1999/08/01 | 86.4 |
| 1999/09/01 | 86.0 |
| 1999/10/01 | 87.4 |
| 1999/11/01 | 87.9 |
| 1999/12/01 | 88.5 |
| 2000/01/01 | 88.7 |
| 2000/02/01 | 88.9 |
| 2000/03/01 | 89.6 |
| 2000/04/01 | 90.3 |
| 2000/05/01 | 90.2 |
| 2000/06/01 | 90.4 |
| 2000/07/01 | 90.5 |
| 2000/08/01 | 89.9 |
| 2000/09/01 | 90.2 |
| 2000/10/01 | 90.0 |
| 2000/11/01 | 89.7 |
| 2000/12/01 | 89.2 |
| 2001/01/01 | 88.6 |
| 2001/02/01 | 88.2 |
| 2001/03/01 | 87.9 |
| 2001/04/01 | 87.6 |
| 2001/05/01 | 86.9 |
| 2001/06/01 | 86.2 |
| 2001/07/01 | 85.8 |
| 2001/08/01 | 85.4 |
| 2001/09/01 | 85.2 |
| 2001/10/01 | 84.6 |
| 2001/11/01 | 84.4 |
| 2001/12/01 | 84.6 |
| 2002/01/01 | 85.1 |
| 2002/02/01 | 85.1 |
| 2002/03/01 | 85.9 |
| 2002/04/01 | 86.1 |
| 2002/05/01 | 86.6 |
| 2002/06/01 | 87.6 |
| 2002/07/01 | 87.3 |
| 2002/08/01 | 87.5 |
| 2002/09/01 | 87.6 |
| 2002/10/01 | 87.3 |
| 2002/11/01 | 87.7 |
| 2002/12/01 | 87.2 |
| 2003/01/01 | 87.7 |
| 2003/02/01 | 87.8 |
| 2003/03/01 | 88.0 |
| 2003/04/01 | 87.2 |
| 2003/05/01 | 87.3 |
| 2003/06/01 | 87.7 |
| 2003/07/01 | 88.1 |
| 2003/08/01 | 87.7 |
| 2003/09/01 | 88.4 |
| 2003/10/01 | 88.4 |
| 2003/11/01 | 89.3 |
| 2003/12/01 | 89.1 |
| 2004/01/01 | 89.1 |
| 2004/02/01 | 89.6 |
| 2004/03/01 | 89.5 |
| 2004/04/01 | 89.8 |
| 2004/05/01 | 90.5 |
| 2004/06/01 | 89.7 |
| 2004/07/01 | 90.5 |
| 2004/08/01 | 90.9 |
| 2004/09/01 | 90.9 |
| 2004/10/01 | 92.0 |
| 2004/11/01 | 91.9 |
| 2004/12/01 | 92.5 |
| 2005/01/01 | 93.3 |
| 2005/02/01 | 94.1 |
| 2005/03/01 | 93.7 |
| 2005/04/01 | 93.9 |
| 2005/05/01 | 94.3 |
| 2005/06/01 | 94.5 |
| 2005/07/01 | 94.3 |
| 2005/08/01 | 94.6 |
| 2005/09/01 | 93.5 |
| 2005/10/01 | 95.0 |
| 2005/11/01 | 95.8 |
| 2005/12/01 | 95.9 |
| 2006/01/01 | 96.7 |
| 2006/02/01 | 96.5 |
| 2006/03/01 | 96.3 |
| 2006/04/01 | 96.9 |
| 2006/05/01 | 96.5 |
| 2006/06/01 | 96.8 |
| 2006/07/01 | 96.7 |
| 2006/08/01 | 97.3 |
| 2006/09/01 | 97.4 |
| 2006/10/01 | 97.0 |
| 2006/11/01 | 97.1 |
| 2006/12/01 | 98.6 |
| 2007/01/01 | 98.1 |
| 2007/02/01 | 98.5 |
| 2007/03/01 | 99.4 |
| 2007/04/01 | 100.1 |
| 2007/05/01 | 100.0 |
| 2007/06/01 | 100.3 |
| 2007/07/01 | 100.6 |
| 2007/08/01 | 100.2 |
| 2007/09/01 | 100.7 |
| 2007/10/01 | 100.3 |
| 2007/11/01 | 100.9 |
| 2007/12/01 | 101.0 |
| 2008/01/01 | 100.6 |
| 2008/02/01 | 99.9 |
| 2008/03/01 | 99.7 |
| 2008/04/01 | 98.6 |
| 2008/05/01 | 98.2 |
| 2008/06/01 | 97.6 |
| 2008/07/01 | 96.5 |
| 2008/08/01 | 95.3 |
| 2008/09/01 | 91.9 |
| 2008/10/01 | 91.4 |
| 2008/11/01 | 89.2 |
| 2008/12/01 | 86.1 |
| 2009/01/01 | 83.6 |
| 2009/02/01 | 83.5 |
| 2009/03/01 | 82.0 |
| 2009/04/01 | 81.5 |
| 2009/05/01 | 80.5 |
| 2009/06/01 | 80.3 |
| 2009/07/01 | 81.5 |
| 2009/08/01 | 82.3 |
| 2009/09/01 | 83.0 |
| 2009/10/01 | 83.1 |
| 2009/11/01 | 84.0 |
| 2009/12/01 | 83.9 |
| 2010/01/01 | 84.9 |
| 2010/02/01 | 84.9 |
| 2010/03/01 | 86.0 |
| 2010/04/01 | 86.9 |
| 2010/05/01 | 88.2 |
| 2010/06/01 | 88.2 |
| 2010/07/01 | 88.9 |
| 2010/08/01 | 89.1 |
| 2010/09/01 | 89.2 |
| 2010/10/01 | 89.3 |
| 2010/11/01 | 89.4 |
| 2010/12/01 | 89.8 |
| 2011/01/01 | 90.0 |
| 2011/02/01 | 90.0 |
| 2011/03/01 | 90.7 |
| 2011/04/01 | 90.1 |
| 2011/05/01 | 90.3 |
| 2011/06/01 | 90.4 |
| 2011/07/01 | 91.2 |
| 2011/08/01 | 91.4 |
| 2011/09/01 | 91.7 |
| 2011/10/01 | 92.2 |
| 2011/11/01 | 92.2 |
| 2011/12/01 | 92.8 |
| 2012/01/01 | 93.8 |
| 2012/02/01 | 94.4 |
| 2012/03/01 | 94.1 |
| 2012/04/01 | 94.9 |
| 2012/05/01 | 94.7 |
| 2012/06/01 | 95.1 |
| 2012/07/01 | 95.6 |
| 2012/08/01 | 95.1 |
| 2012/09/01 | 95.3 |
| 2012/10/01 | 94.9 |
| 2012/11/01 | 96.1 |
| 2012/12/01 | 96.9 |
| 2013/01/01 | 96.6 |
| 2013/02/01 | 97.3 |
| 2013/03/01 | 97.4 |
| 2013/04/01 | 97.2 |
| 2013/05/01 | 97.4 |
| 2013/06/01 | 97.8 |
| 2013/07/01 | 97.3 |
| 2013/08/01 | 98.0 |
| 2013/09/01 | 98.3 |
| 2013/10/01 | 98.8 |
| 2013/11/01 | 99.1 |
| 2013/12/01 | 99.2 |
| 2014/01/01 | 98.4 |
| 2014/02/01 | 99.2 |
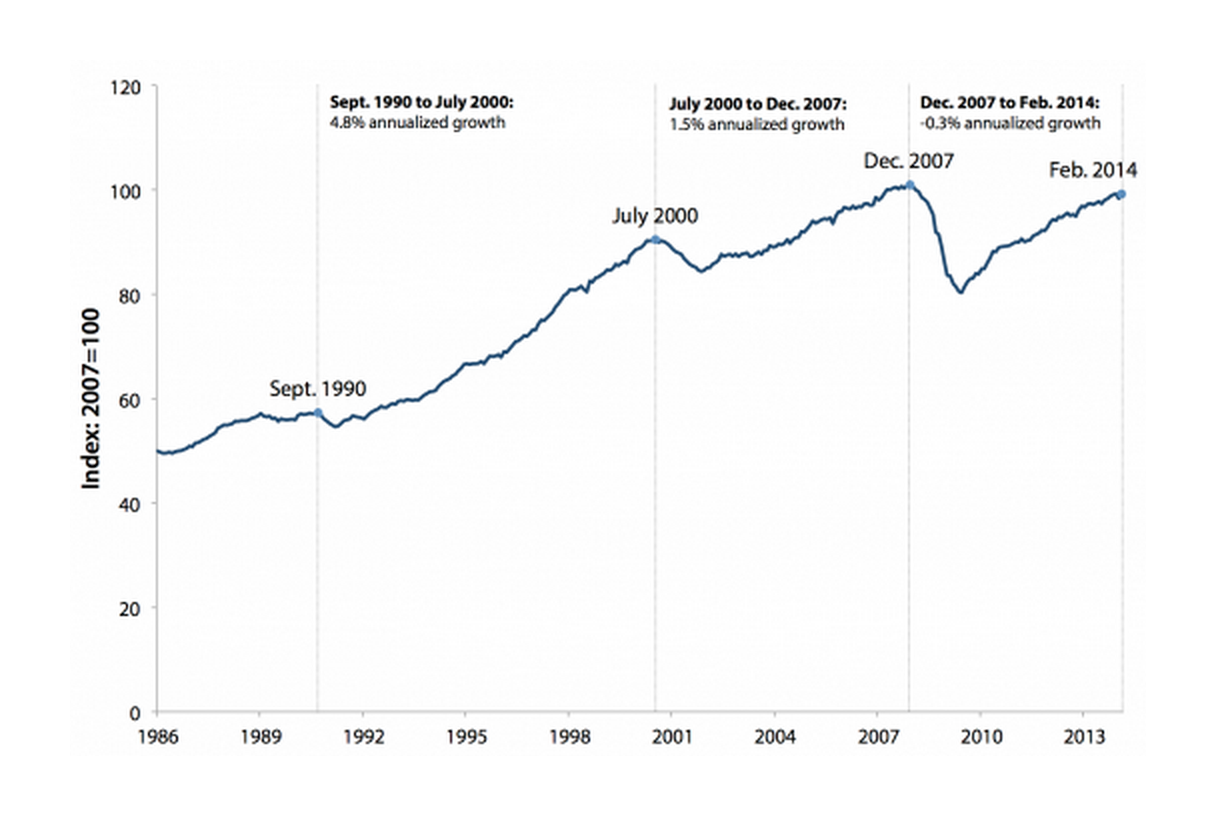
Source: Economic Policy Institute analysis of Federal Reserve Board (FRB 2014)
Manufacturing output grew only 1.5 percent per year between July 2000 and December 2007, in part due to the rapid growth of imports from China and other low-wage countries. The growth of all imports from China between 2001 and 2011, which are dominated by manufactured products, eliminated more than 2.7 million U.S. jobs (Scott 2012a). More than three-fourths of jobs lost were in the manufacturing sector.
Since the last business cycle peak in 2007, U.S. manufacturing output has declined 0.3 percent per year. Manufacturing output will eventually surpass the prerecession peak, as long as the recovery continues, but the rate of growth in manufacturing remains depressed, especially relative to growth in the 1990s.
The manufacturing recovery is, in turn, being weighed down by the hangover from the Great Recession in the overall U.S. economy. One of the best overall indicators of the health of the domestic economy is the output gap, shown in Figure U. The U.S. output gap measures the relationship between actual and potential output (gross domestic product, or GDP). A positive output gap indicates that the economy is producing above potential (which is possible for short periods of time, usually correlated with rising inflation and the possible end of a business cycle, as occurred in 2000).
U.S. output gap, 2000–2014*
| Year | Difference between actual GDP and potential GDP |
|---|---|
| 2000 | 1.4% |
| 2001 | -1.4% |
| 2002 | -2.4% |
| 2003 | -2.3% |
| 2004 | -1.0% |
| 2005 | -0.2% |
| 2006 | -0.2% |
| 2007 | -1.1% |
| 2008 | -3.1% |
| 2009 | -7.1% |
| 2010 | -5.6% |
| 2011 | -5.2% |
| 2012 | -4.3% |
| 2013 | -4.1% |
| 2014 | -3.3% |
* Data for 2014 are estimated.
Note: The output gap is presented as the percent by which actual GDP exceeds or falls short of potential GDP.
Source: Economic Policy Institute analysis of International Monetary Fund World Economic Outlook database (2014)
A negative output gap indicates that the economy is operating at below potential. One of the largest output gaps on record occurred in 2009, during the trough of the Great Recession, when output fell 7.1 percent below potential. Even in 2014, in the seventh year since the onset of the recession late in 2007, the output gap remains 3.3 percent. At current (2014) rates of output, the output gap is $737 billion (CBO 2014). Eliminating the output gap would likely create roughly 4.1 million jobs. This would have a significant impact on steel demand.
In the absence of a strong recovery in manufacturing, or in the economy overall, demand for steel remains depressed. With low domestic demand, domestic steel producers are particularly vulnerable to surging volumes of unfairly traded imports. U.S. steel producers are susceptible to predatory pricing and beggar-thy-neighbor practices which have resulted from structural overcapacity in China and other Asian countries due to strong state support for steel production in these countries.
IV. The future of the domestic steel industry depends on effective trade remedy enforcement
When surges of unfairly traded steel have inundated the U.S. market, trade remedies have proven crucial to the domestic industry’s survival. Effective enforcement of trade remedies has permitted the domestic industry to regain shipments, maintain employment, and improve operating performance in the face of such unfair trade practices. When trade remedies are not enforced, on the other hand, the industry may be forced to withstand years of further injury before achieving needed relief. In the current crisis, effective trade remedy enforcement will once again be essential if the industry is to survive and thrive.
A. The importance of trade remedies in addressing steel surges
As reviewed in the previous section, the steel industry is structurally vulnerable to production overcapacity, excess supply, and global gluts of dumped and subsidized steel exports. This susceptibility to import surges is due to distortions caused not only by a combination of high fixed costs, capital intensity, and economies of scale, but also due to aggressive state support and involvement in the steel industry around the world. When global demand suffers a shock such as the 1998 Asian financial crisis and the 2008 global financial crisis, and uneconomic producers continue to expand and flood export markets with low-priced product, it causes a crisis for the global industry. The overhang can last for years, particularly in the current environment, where the recovery remains sluggish at best and where much of the build-up in capacity is not based on market fundamentals but flows from state intervention, such as in China and other Asian countries.
There have been numerous efforts over the years to address the global steel industry’s structural overcapacity problems through international forums such as the OECD and through bilateral and regional dialogue. The OECD Steel Committee, for example, was established in 1978 to address the massive growth in overcapacity in the 1970s and resulting glut in global supply (OECD 2009). Among the goals of the committee was to “facilitate needed structural adaptations,” “promote rational allocation of resources,” and “avoid encouraging economically unjustified investments” (ibid.). For a number of years, the United States has also participated in a U.S.-China Steel Dialogue to address subsidies and overcapacity, and in the North American Steel Trade Committee to develop coordinated positions for the industry with Canada and Mexico (USTR 2014). Despite these cooperative efforts, the structural incentives for states to continue to support uneconomic investments in the industry persist, and huge capacity overhangs continue to drive gluts in global steel supply and waves of unfairly traded imports when crisis hits.
Because the causes of the crises relate to the structure of the steel industry and the web of government support policies for steel around the globe, processes such as rational reductions in capacity and reciprocal negotiations with other countries, while valuable, progress far too slowly to redress the immediate harm to U.S. steel producers and their workers. Trade remedies are thus a critical tool for the domestic industry to defend itself when crisis hits. For this reason, steel producers in the U.S. and around the world have relied again and again on trade remedies to address repeated surges in unfairly traded steel.
Antidumping and countervailing duty investigations
Antidumping and countervailing duty investigations may be self-initiated by the administration or they may be initiated in response to petitions filed by a domestic industry and/or its workers. Petitions are filed simultaneously with the U.S. Department of Commerce and the U.S. International Trade Commission. The Department of Commerce investigates to determine whether the imports covered by the petition are being dumped in the U.S. at below-fair-value prices or subsidized by a foreign government. The department also determines the extent of such dumping or subsidization and calculates dumping and subsidy rates for individual foreign producers and exporters. The International Trade Commission investigates to determine whether the domestic industry is being injured, or threatened with injury, by the imports concerned. Both the department and the commission must make affirmative determinations for an antidumping or countervailing order to be imposed. The orders require importers of the covered goods to pay additional import duties on those goods, and the duty rates are set by the Department of Commerce at levels intended to offset the dumping and subsidization that has been found.
The U.S. trade remedy system is particularly well-suited to provide relief from the injury caused by surges of unfairly traded steel imports. In a successful case, the amount of the duties imposed is supposed to be equal to the amount needed to offset the dumping that is occurring or the value of subsidies received.
First, the system is based on self-help. While there are many cases in which it may be appropriate for the government to initiate trade remedy actions on behalf of a domestic industry, the industry and its workers do not have to wait for government action to seek relief. The system allows private domestic interested parties—both companies and unions—to petition for antidumping and countervailing duties, and it requires automatic initiation and investigation if certain thresholds are met. The system thus ensures that those who are in the best position to know that they need help can take action to defend themselves from unfairly traded imports. The system is also supposed to ensure that the kinds of political or diplomatic pressures which may make self-initiated government action more difficult will not prevent industries and workers from taking action.
Second, the relief resulting from a successful antidumping or countervailing duty petition is relatively speedy. Provisional relief in the form of bonding and cash deposit requirements for importers may be available as soon as three to five months after a countervailing duty petition is filed or five to seven months after an antidumping petition is filed. While final orders may not be imposed until about 14 months after filing, distortions in the market can be redressed much sooner than that. In some cases, the filing of the petition alone will change exporter and importer behavior. The provisional relief available at the preliminary stage often results in volume and price changes that bring relief to the domestic industry while the case is pending.
Third, while global safeguards are an important tool for addressing global surges, antidumping and countervailing duties provide relief that is specific to the products that are being dumped and/or subsidized and injuring or threatening injury to the domestic industry, and the countries exporting the products. Antidumping and countervailing duties provide meaningful relief that is specifically targeted to the products, countries, and unfair trade practices causing injury to the domestic industry.
Fourth, the antidumping and countervailing duty laws are administrated through a quasi-adjudicatory proceeding at two agencies, the U.S. Department of Commerce and the bipartisan U.S. International Trade Commission. The proceedings are transparent and open to all interested parties, and the agencies’ final determinations, along with the reasoning underlying those determinations, are published and available to the public. The results of the proceedings are also subject to judicial review. The process is thus designed to provide the concerned parties and public with confidence that the determinations are objective, reasonable, and fact-based. Fulfilling these goals not only contributes to better quality outcomes, it also builds trust in the system and supports the legitimacy of the determinations reached. Domestic producers have expressed concerns, however, that where discretion exists in the enforcement process it may at times be exercised in ways that deny the industry the full relief it requires. For industries facing unfair import competition, it is important that enforcement discretion be exercised in a manner that gives full effect to the remedial purpose of the law.
For all of these reasons, trade remedies provide a critical first line of defense for the U.S. steel industry and its workers when a surge of unfairly traded steel hits the U.S. market. As explained in more detail below, effective enforcement of those remedies can make all the difference for domestic steel producers as they struggle to survive the kind of crisis the industry currently faces.
B. Benefits of trade remedy enforcement for the U.S. steel industry and its workers
The relief that the domestic steel industry and its workers are able to obtain through secure and effective enforcement of U.S. trade remedy laws is critical to the industry’s survival.
Effective enforcement gives the domestic industry the space it needs to regain volume and more rational pricing, improve capacity utilization, increase efficiency and productivity, and achieve reasonable profitability, which in turn permits companies to make needed capital investments. By providing needed stability in the domestic market, import relief has also permitted groundbreaking labor-management agreements addressing legacy costs and modernizing work rules and compensation to endure, laying a more solid foundation for future competitiveness. Without the conditions of fair trade that import relief creates, the industry would never be able to obtain adequate returns on invested capital or make needed investments in its future. These positive changes cannot, however, insulate the industry from future injury when the next surge of imports again eats into market share, prices, and operating margins. When that happens, effective trade remedy enforcement once again becomes the first line of defense for the domestic industry and its workers.
A review of a few specific cases illustrates the importance of trade relief for the steel industry.
The most significant and wide-ranging assessment of the impact of import relief on the steel industry to date was undertaken by the U.S. International Trade Commission in 2005 to evaluate the effectiveness of the safeguard relief imposed on a variety of steel products in 2002 (USITC 2005). In response to requests from the U.S. Trade Representative and the Senate Finance Committee in 2001, the commission instituted safeguard investigations to determine whether certain steel products were being imported in such increased quantities as to be a substantial cause of serious injury, or threat thereof, to the domestic industry. The commission reached affirmative determinations with regard to a number of products, and the president imposed temporary import quotas and duties on certain steel products effective March 20, 2002. The products subject to the safeguard measures included certain carbon and alloy flat-rolled products (slab, plate, hot-rolled, cold-rolled, and coated), tin, hot bar, cold bar, rebar, welded pipe and tube, fittings, stainless bar, stainless rod, and stainless wire. The measures were terminated in December of 2003.
In its review, the commission found that imports from the countries subject to the safeguard decreased, both in absolute volume and market share. The data are summarized in Table 7. Overall, imports of the covered products fell by 7.5 million short tons, or 52.7 percent, from 2001 to 2003.
U.S. imports of steel products covered by safeguard measures, 2001 and 2003
| Import volume (thousands of short tons) | Change in imports | Import market share (%) | ||||
|---|---|---|---|---|---|---|
| 2001 | 2003 | Volume change (thousands of short tons) | Percent change | 2001 | 2003 | |
| Carbon & alloy flat products | 9,947 | 4,818 | -5,129 | -51.6% | 5.8 | 2.8 |
| Tin | 386 | 218 | -168 | -43.5% | 11.5 | 7.5 |
| Hot bar | 704 | 555 | -149 | -21.2% | 6.5 | 5.2 |
| Cold bar | 186 | 102 | -84 | -45.2% | 15.2 | 8.6 |
| Rebar | 1,246 | 226 | -1,020 | -81.9% | 14.9 | 2.6 |
| Welded pipe & tube | 1,489 | 623 | -866 | -58.2% | 20.2 | 9.9 |
| Fittings | 132 | 100 | -32 | -24.2% | 50.5 | 45.5 |
| Stainless bar | 89 | 51 | -38 | -42.7% | 34.4 | 23.3 |
| Stainless rod | 58 | 31 | -27 | -46.6% | na | na |
| Stainless wire | 26 | 23 | -3 | -11.5% | 44.6 | 35.7 |
| Total | 14,263 | 6,747 | -7,516 | -52.7 | ||
Note: Market share data for stainless rod is confidential.
Source: U.S. International Trade Commission (2005)
From 1999 until the safeguards were imposed in 2002, 24 U.S. steel companies had filed for bankruptcy; nine more filed for bankruptcy while the safeguards were in effect (USITC 2005). With the safeguard relief in place and the tide of imports stemmed, the resulting market stability allowed major steel companies to purchase and consolidate bankrupt companies and other assets, leading to a much less fragmented industry that was better able to use its assets economically and competitively.
The industry was also able to make capital investments to upgrade existing facilities, invest in new technologies, reduce costs, and improve quality. Between 2001 and 2005, over $1.8 billion in major capital investments (or anticipated investments) were publicly announced, as were a number of other investment projects for which no investment amount was reported (USITC 2005). During the 2005 review, integrated producers reported that they believed $7 billion to $9 billion in investment would be needed over the next three years to stay competitive (ibid.). When pricing and profitability improved after the industry restructured during the relief period, the industry as a whole was in fact able to invest $10.9 billion in capital expenditures between 2006 and 2008 (U.S. Census Bureau various years).
As imports declined, the domestic industry was able in many instances to increase its shipments and sales, gain market share, improve its capacity utilization, and make gains in productivity and operating income. Across all of the product areas examined for which public data are available, domestic producers saw their U.S. shipments increase by 6.9 million short tons from 2001 to 2003 and their net U.S. sales increase by 5.8 million short tons and $3.7 billion while the relief was in place. As the industry restructured, domestic producers of all products except welded pipe and tube also improved their productivity from 2001 to 2003. Producers in six of the nine product areas with public data also saw their operating income and operating margins for the product improve.
As part of the bankruptcy and restructuring process that began before the safeguards were imposed, the United Steelworkers union and the industry reached “innovative new collective bargaining agreements” that incorporated “workforce restructuring, variable and competitive cost structures, reduced healthcare costs, and fewer job classifications” (USITC 2005). The union made sacrifices to reach these agreements in order to improve industry productivity, lower fixed costs, and protect retiree welfare. The market stability the safeguards provided allowed these agreements to be implemented and their goals to be met.
In short, the safeguard relief provided a very fragile and fragmented domestic industry with the market stability it needed to consolidate, restructure, regain shipments and market share, and improve productivity. The painful but necessary steps that steel producers and their workers took enabled the industry to emerge stronger than it had been, and these steps were only possible with import relief in place. Unfortunately, as important as those steps were, the recent industry data confirm that the restructuring the safeguard permitted does not immunize the industry from renewed injury due to the most recent wave of steel imports.
The benefits of effective trade remedy enforcement for the U.S. steel industry are also evident in the U.S. International Trade Commission’s reviews of antidumping and countervailing duty orders on steel.
For example, in a 2007 review of antidumping orders on rebar from eight countries, the commission noted that the volume and market share of imports “fell dramatically” as a result of the orders and domestic rebar prices consequently “increased substantially” (USITC 2007). While falling demand in 2002 initially inhibited improvement, productivity, sales, employment, and operating margins improved dramatically from 2003 to 2006. While an increase in demand also contributed to the improvements, the commission noted the improvements had occurred with the orders in effect, and found that the “industry’s continued healthy performance … is linked to the continuation of the antidumping duty orders.” Offsetting the dumping that was occurring removed major market distortions, allowing the industry to regain volume and rational pricing, add jobs, and improve its financial performance.
Similarly, in a 2001 review of a countervailing duty order on grain-oriented silicon electrical steel (GOES) from Italy and antidumping orders on GOES from Italy and Japan, the commission found that import volumes “fell dramatically” after the orders were imposed and “have remained substantially below the levels they attained during the original investigations” (USITC 2001). The commission also found that the domestic industry’s performance “improved significantly” after the orders were imposed, production and capacity utilization increased, and the improvements allowed the industry to return to “a relatively healthy state.” The commission also noted that with the orders in place domestic producers had “modernized existing capacity and added needed additional capacity.” The striking improvements reflect the magnitude of the market distortions caused by dumped and subsidized imports. Once such false advantages for unfairly traded imports were neutralized, the true economic competitiveness of U.S. producers allowed them to not only survive but thrive.
A review of antidumping orders on stainless steel flanges from India and Taiwan further demonstrates the benefits of relief from unfairly traded imports. In those cases, a tripling of imports from 1990 to 1992, combined with underselling by imports and falling prices, had eroded the domestic industry’s market share, production, capacity utilization, employment, and financial performance (USITC 2000). Imports declined markedly after orders were imposed in 1994, and remained well below the levels seen in the original investigations. As a result, domestic production and shipments increased. As noted by the commission, “Responding domestic producers reported that during the post-order period the domestic industry has invested in its production facilities to improve productivity and increase employment and that, as a consequence, financial performance improved.” Again, once the market was allowed to operate in conditions of fair trade and free from the false signals created by dumping, the U.S. industry was more than capable of competing with imports and returning to a more sustainable level.
In short, effective enforcement of trade remedies has provided a vital lifeline to the U.S. steel industry and its workers over the years. When foreign producers saddled with excess capacity in eras of declining demand target the U.S. market, and when foreign governments’ aggressive support provides the incentives and the means to sell into the U.S. at rock-bottom prices in order to keep foreign assets and workers employed, trade remedies have proven absolutely essential to the domestic industry’s survival. When those remedies are effectively enforced, they can restore conditions of fair trade, remove artificial advantages for unfairly traded imports, and discipline import volume and prices. This permits the domestic industry to regain lost volumes and rational pricing structures and thus improve operating margins. Relief allows workers to retain and gain high-quality jobs, and it provides the space for needed industry restructuring and investment.
C. Continued injury in the absence of trade relief
Just as effective enforcement of the trade remedy laws delivers important benefits to the domestic steel industry and its workers, the denial of import relief can leave the industry vulnerable to further injury.
In May 2001, U.S. domestic producers of circular welded pipe (CWP) and the United Steelworkers union filed a petition seeking antidumping duties on imports of CWP from China (USITC 2002). The Department of Commerce found that CWP from China was being dumped in the U.S. market at margins ranging from zero to 36.4 percent. Though overall imports from China had increased from 1999 to 2001 while the domestic industry’s market share declined, based on confidential data regarding imports from Chinese producers with more than de minimis dumping margins, the commission concluded that the increase in imports was not significant. While a number of the domestic industry’s indicators declined from 1999 to 2001, the commission noted that prices had not been suppressed or depressed and the industry remained profitable. The commission therefore reached a negative determination and no order was imposed.
Five years after the commission’s negative determination, domestic CWP producers and the United Steelworkers union again filed petitions seeking relief from imports of CWP from China, alleging that the imports were being dumped and subsidized and causing injury to the domestic industry (USITC 2008). Total annual CWP imports from China, which were 157,000 short tons in 2001, had reached 748,000 short tons by 2007. The Department of Commerce found the imported pipe was being dumped at margins ranging from 69.2 percent to 85.6 percent and subsidized by margins ranging from 29.6 to 615.9 percent.
Since the time the previous case was decided, the domestic industry’s annual production, shipments, sales, and market share had all declined. The industry, which had employed 2,947 to 3,172 production workers a year from 1999 to 2001, was employing only 2,450 workers in 2007. To the extent the domestic industry was able to hold on to market share from 2005 to 2007, the commission found it was due to their decision to compete with Chinese imports on price, which led to a decline in the industry’s operating income. By 2007, the industry’s operating income had fallen below levels seen in the previous period. In light of these facts, the commission found that the domestic CWP industry was being materially injured by reason of imports from China, and, in 2008, duties were imposed.
A similar pattern emerges for the wire rod industry. In November of 2005, U.S. domestic producers of wire rod filed petitions alleging that they were being injured by imports of dumped wire rod from China, Germany, and Turkey. Imports from the three countries had increased 88.8 percent from 2002 to 2004 and gained more than 10 percentage points of market share while domestic market share declined (USITC 2006). The commission noted that prices had increased, changes in the industry’s performance did not appear to correlate with changes in import volume, and the industry had also been affected by production curtailments and work stoppages, and it therefore found that there was no reasonable indication that the domestic industry was suffering injury by reason of subject imports. The investigations thus terminated and no relief was imposed.
On January 31, 2014, U.S. domestic wire rod producers again petitioned for relief from imports from China, alleging that the imports were dumped and subsidized and causing injury to the domestic industry. The domestic industry’s shipments, sales volume, and production and related workers were all lower in the 2011 to 2013 period than they had been when the prior case was filed (USITC 2006, 2014b). In addition, while the industry enjoyed an operating income margin of 14.3 percent in 2004 and 9.2 percent in the first three quarters of 2005, its margins from 2011 to 2013 ranged from just 4.2 percent to 7.1 percent. The commission preliminarily determined that there was a reasonable indication that the wire rod industry is suffering injury due to imports from China, and final determinations in the case are pending.
In short, when steel producers are unable to get relief from unfairly traded imports, the consequences can be grave. Without the discipline of antidumping or countervailing duty orders, imports can continue to increase and seize market share from domestic producers. Domestic production, shipments, and sales may contract, harming the industry’s ability to maintain its capacity and employ workers. In some cases, producers have had to endure sustained injury over a number of years before obtaining needed relief. In the interim, the price paid in lost investments, wages, and jobs can be very steep.
D. Ensuring trade remedies provide meaningful relief
Enforcement of the trade remedy laws is critical to the survival of the U.S. steel industry. Policymakers thus should ensure that trade remedy tools are capable of addressing the full measure of market distortions that dumping and subsidies cause.
To ensure the trade remedy tools available to the U.S. steel industry are functioning as they should, policymakers should review whether changes in practice, regulation, or statute may be needed. Where the agencies or the courts have interpreted or applied the law in a way that deviates from congressional intent and makes it harder for injured industries to obtain needed relief, lawmakers should clarify the law. Where global actors have developed new practices that existing rules are inadequate to address, those rules should be updated. Where WTO obligations have been interpreted by that organization in ways that undermine the effectiveness of U.S. laws, the U.S. should seek a rebalancing of rights and obligations to ensure that injurious dumping and subsidies can be fully redressed.
A few issues of particular relevance to the current crisis in the U.S. steel industry are highlighted below.
In the context of antidumping and countervailing duty investigations by the Department of Commerce, there are numerous areas in which the department must interpret the statute, fill gaps in the statute, and apply the law to the complicated factual record in each particular case. Where the department has discretion under the law, it is essential that the methodologies used allow the department to measure the full extent of dumping and subsidization that is occurring and to assign duty margins that fully offset these unfair trade practices. This is necessary to ensure that the remedial purpose of the law is fulfilled. Where the department’s interpretation or application of the law is inconsistent with congressional intent, Congress may have to provide clarification to ensure the law is fairly and faithfully enforced consistent with the goal of fully offsetting dumping and subsidies. Concerns about the need for such effective enforcement have also been expressed where foreign governments appear to seek to maintain a false advantage for their producers through interference or pressure on the agency.
The law is also subject to interpretation by the federal courts, whose decisions can impact the department’s ability to fully counteract subsidies and dumping. One tool that is critical for securing the cooperation of foreign companies and governments in the department’s proceedings is the department’s ability to assign dumping or subsidy margins to foreign producers and exporters based on the use of an adverse inference when respondents fail to cooperate. Unfortunately, judicially created requirements that the department establish a relationship between such adverse rates and the hypothetical economic reality of the noncooperative respondents are both administratively unworkable and undermine the compliance incentive such rates are supposed to create. Similarly, judicial decisions regarding the way the department assigns rates to respondents it does not have the resources to individually review have created new burdens for the department and will likely undermine duty discipline.
The law, and the manner in which it is interpreted and applied, must also be adequate to address more recent industry developments. As China has become the world’s largest steel exporter, Chinese product is entering a wide array of markets around the world, including markets in other Asian countries that export to the U.S. and elsewhere. A further processed steel product made from Chinese inputs may be exported at below-market prices not just because the country exporting the finished product is participating in unfair trade practices, but also because of dumping and subsidization embedded in the Chinese inputs themselves. Under existing antidumping and countervailing duty laws, there is no clear way to place duties on the downstream product that reflect the dumping and subsidies embedded in the Chinese inputs outside of circumvention proceedings, which are only available in limited circumstances. As China continues to emerge as the major player in world steel markets, and as supply chains become increasingly globalized, the inability to address embedded inputs threatens the continued effectiveness of the trade remedy laws.
With regard to injury determinations, law and practice must permit the U.S. International Trade Commission to analyze and recognize injury to highly capital-intensive industries such as the steel industry. The steel industry needs to generate operating margins that provide a reasonable return on investment over the long term. Thus, even profitable segments of the industry may be suffering injury if import competition is preventing the achievement of sufficient returns over the long term.
This may be a particular problem when the steel industry is struggling to recover from a recession. In such periods, traditional indicators of domestic industry injury such as sales volumes and operating income may be improving as the economy recovers, but these apparent improvements may be insufficient to bring the industry back up to sustainable levels. The injury statute directs the commission to evaluate the impact of imports on both actual and “potential” declines in domestic industry performance and actual and “potential” negative effects on employment, growth, investment, and industry development and production efforts. But because the commission has failed to give meaning to the word “potential,” “injury” may be measured against the depths of a recession rather than from the previously sustainable economic situations. This has deprived domestic producers of needed relief when their recovery is stifled by unfair import competition.
In addition, the statute directs the commission to evaluate a range of factors that may indicate injury by reason of subject imports; this should permit the commission to find injury if some but not all factors are present, rather than be interpreted as a requirement that each factor must be met in order to establish entitlement to import relief.
Once orders are imposed, it is critical that they be fully and effectively enforced. Publicly available information indicates there is a fairly broad range of evasion problems undermining the effectiveness of orders on steel and other products. For example, overseas logistics companies openly advertise services to falsify documents and transship product in order to avoid duty liability. The administration, Congress, and other countries should work together to prevent and penalize such large-scale illegal tactics.
In addition, the domestic industry and workers can play a key role in providing information and expertise to assist with enforcement efforts when orders are being circumvented and duties evaded. Making the enforcement process more transparent, accessible, and accountable to domestic interested parties could go a long way to ensuring that the relief that is promised under the law is delivered.
V. Conclusion
The U.S. steel industry is facing the worst import crisis it has seen in more than a decade. In the aftermath of the Great Recession, steelmakers in other countries, backed by aggressive government support, continued to add production capacity as demand stagnated.
Global excess steel capacity is now over half a billion metric tons, more than twice the level in the last crisis of a decade ago. Much of the excess capacity is concentrated in China, South Korea, and India. Further capacity additions are planned overseas, which will far outstrip projected growth in demand.
The open and large U.S. market has been the prime target for the resulting massive excess supply, and, since 2011, U.S. steel imports have surged, leading to reduced U.S. output and declining import prices.
The diversion of dumped and subsidized steel product from China and Korea is fueling the increased imports of unfairly traded products from other countries. China and Korea accounted for more than three-fourths (77.9 percent) of the growth in global steel exports between 2003 and 2012. Imports of Chinese steel by Korea and Japan surged between 2009 and 2012. Korea and Japan, in turn, are themselves major exporters to the United States.
The import surge has depressed domestic steel production and revenues, leading to sharp declines in net income in the U.S. steel industry over the past two years, with $1.2 billion in net losses in 2013 alone.
Workers in the domestic steel industry have lost thousands of jobs and suffered reduced wages, and they are threatened with additional rounds of layoffs if unfair import competition is not curtailed.
The health of the domestic steel industry is a national concern because U.S. steel production supports more than half a million U.S. jobs, across every state of the nation. These jobs are at risk if the U.S. does not fully and effectively enforce its trade remedy laws.
Trade remedies have been critical to the survival of the steel industry and the more than half-million workers who depend on that industry, particularly when the industry is faced with the kind of crisis that threatens it today. Policymakers should ensure that trade remedies are effectively enforced, that enforcement discretion is exercised consistent with the remedial goals of the statute, and that the remedies do in fact fully redress the unfair trade practices distorting the U.S. market. Policymakers should therefore review areas in which changes in practice, methodologies, regulations, and the law may be needed to ensure that the steel industry and its workers can continue to rely on these vital tools.
—The authors thank Michael Wessel of the Wessel Group for comments and William Kimball of EPI for research assistance.
—This research was made possible by support from the Alliance for American Manufacturing.
About the authors
Terence P. Stewart is the managing partner of the Law Offices of Stewart and Stewart, a 56-year-old Washington-based trade law and government relations firm. Mr. Stewart’s practice focuses on international trade, notably trade remedies, World Trade Organization (WTO) and Free Trade Agreement (FTA) dispute settlement, WTO and FTA negotiations, and customs law. Among his over 100 publications is the widely cited work in WTO proceedings, The GATT Uruguay Round: A Negotiating History (1986-1992)(Vols. I-III); The End Game (Part I)(Vol. IV). Mr. Stewart was an adjunct professor at Georgetown University Law Center for nearly 20 years through 2012. He holds a law degree from Georgetown, an MBA from Harvard University, and a B.A. from the College of the Holy Cross.
Elizabeth J. Drake is a partner at the Law Offices of Stewart and Stewart. She has experience in an array of international trade law matters, including antidumping and countervailing duty proceedings, section 301 petitions, international and bilateral trade agreements, and international labor standards. Prior to joining Stewart and Stewart, Ms. Drake served for six years as an international policy analyst at the AFL-CIO. Ms. Drake is the author and co-author of a variety of publications on international trade matters, including China’s industrial policies, climate change, and Buy America laws. She has a J.D. from Harvard Law School and a B.A. from the University of California at Berkeley.
Stephanie M. Bell is an associate at the Law Offices of Stewart and Stewart. She works on a variety of issues relating to antidumping and countervailing duty proceedings, as well as other trade-related issues such as nontariff barriers, compliance with WTO obligations, and global food prices. Ms. Bell assists in editing the Handbook of WTO/GATT Dispute Settlement (Martinus Nijhoff Publishers). She has a J.D. from American University, Washington College of Law, and a M.A. in international affairs from American University, School of International Service.
Jessica Wang is a trade consultant at the Law Offices of Stewart and Stewart. She provides quantitative and qualitative analyses on international trade remedy cases involving both market and nonmarket economies. She also conducts research on economic and policy issues, monitors trade flows, and reviews and analyzes industrial policies and trade regimes. Prior to joining Stewart and Stewart, she was a consultant at the United Nations Development Programme (UNDP) and a junior professional associate at the World Bank. She received her B.A. from Wuhan University in China and her Master of International Affairs from Columbia University. Ms. Wang is not a lawyer.
Robert E. Scott joined the Economic Policy Institute in 1996 and is currently director of trade and manufacturing policy research. His areas of research include international economics, trade and manufacturing policies and their impacts on working people in the United States and other countries, the economic impacts of foreign investment, and the macroeconomic effects of trade and capital flows. He has published widely in academic journals and the popular press, including The Journal of Policy Analysis and Management, The International Review of Applied Economics, and The Stanford Law and Policy Review, as well as The Los Angeles Times, Newsday, USA Today, The Baltimore Sun, The Washington Times, and other newspapers. He has also provided economic commentary for a range of electronic media, including NPR, CNN, Bloomberg, and the BBC. Mr. Scott has a Ph.D. in economics from the University of California at Berkeley.
Endnotes
1. Seamless OCTG is made from steel billets. Welded OCTG is made from steel sheet (USITC 2013a, 9).
2. The U.S. gas drilling rig count reached a peak in June 2008, the highest level since record keeping began in 1987 (Calgary Herald 2008).
3. Shipments as reported by the AISI are expressed in net tons. International data (covered elsewhere in this report) are generally reported using millions of metric tons. Net tons can be converted to metric tons by multiplying the net amount by .9071848 (AISI 2014a, 2).
4. The number of petitions is based on authors’ calculations from historical case records. Each petition on a particular product and country is counted as one petition. An antidumping and countervailing duty petition on the same product and country are counted as two petitions, and petitions on the same product from two countries are counted as two petitions, consistent with agency practice.
5. This sector is formally titled “Iron and steel mills and ferroalloy manufacturing,” and is BLS industry 50.
6. Jobs at risk were estimated assuming current year (2012) production technology. The model was estimated with real industrial output estimates from the BLS-EP (2014c).
7. A real, domestic employment requirements matrix for 2012 is used for this analysis, to reflect current production technology. Domestic employment requirement tables are used to remove the effects of imports. (BLS-EP 2014b)
8. The indirect import assessment did include an adjustment for the steel content of auto parts used in the production of imported motor vehicles. The auto parts industry is one of the top 10 users of basic steel products.
9. For example, auto assembly (NAICS 3361) is a relatively small, direct consumer of steel products. However, it is heavily reliant on the products of motor vehicle body manufacturing (NAICS 3362) and motor vehicle parts manufacturing (NAICS 3363), which are heavy consumers of steel products.
10. While minimills have lower fixed costs and are thus more flexible than integrated mills, the global steel industry is still dominated by integrated mills.
11. Antidumping duties are in place in the United States on hot-rolled carbon steel from China, Taiwan, and the Ukraine. Antidumping and countervailing duties on hot-rolled carbon steel are also in force against India, Indonesia, and Thailand (USITC 2014a). Antidumping duties were in place against Russia but were suspended upon review in 2011.
12. Carbon steel plate from China, which is used in the manufacture of some oil country tubular goods and other downstream steel products, has been subject to antidumping duties since October 1997 (USITC 2014a).
13. EPI analysis of data in World Steel Association (2013b, Tables 27 and 28).
References
Adams, Brigadier General John. 2013. Remaking American Security: Supply Chain Vulnerabilities & National Security Risks Across the U.S. Defense Industrial Base. Alliance for American Manufacturing.
American Iron and Steel Institute, et al. (AISI). 2010. North American Steel Industry: Recent Market Developments and Key Challenges Going Forward. Presentation at the 68th Session of the OECD Steel Committee, Paris, May, 6-7.
American Iron and Steel Institute (AISI). 2013. 2012 Annual Statistical Report.
American Iron and Steel Institute (AISI). 2014a. 2013 Annual Statistical Report. (Forthcoming).
American Iron and Steel Institute (AISI). 2014b. “February Steel Shipments Down 3.5 Percent From January, Down 0.9 Percent from Prior Year.” Press release, April 9.
Boston Consulting Group. 2002. Breaking the Stalemate: Value Creation Strategies for the Global Steel Industry.
Breakbulk. 2013. “SteelAsia to Expand Philippines’ Steelmaking Capacity.” Breakbulk.com, November 18.
Bureau of Labor Statistics (BLS). 2013. “Producer Price Indexes: Industry and Commodity data” [Excel files].
Bureau of Labor Statistics (BLS). 2014. “Employment, Hours and Earnings from the Current Employment Statistics Survey (National).”
Bureau of Labor Statistics, Employment Projections (BLS-EP). 2014a. “About the Numbers: Projections Methodology.”
Bureau of Labor Statistics, Employment Projections (BLS-EP). 2014b. “Employment Requirements Matrix.”
Bureau of Labor Statistics, Employment Projections (BLS-EP). 2014c. “Inter-industry Relationships (Input-Output Matrix).”
Calgary Herald. 2008. “U.S. Gas Rig Count Rises to a Record.” June 28, p. E4.
Centre for European Policy Studies and Economisti Associati (CEPS and EA). 2013. Assessment of Cumulative Cost Impact for the Steel Industry: Final Report.
Congressional Budget Office (CBO). 2014. The Budget and Economic Outlook: 2014 to 2024.
De Carvalho, Anthony. 2012. Excess Capacity in the Global Steel Industry. Presentation at the 73rd Session of the OECD Steel Committee, Paris, December 6–7.
De Carvalho, Anthony. 2013. Steelmaking Capacity. Presentation at the 74th Session of the OECD Steel Committee, Paris, July 1–2.
De Carvalho, Anthony, and Laurent Daniel. 2012. Trends in the Global Steel Market. Presentation at the 72nd Session of the OECD Steel Committee, Paris, May 31–June 1.
Dunn, James. 2014. “USS-POSCO Steel Warns of Possible 690 Layoffs Due to Low Bookings, but Holds Off.” San Francisco Business Times, January 6.
Economic Times. 2013. “Steel Makers to Add 24 MT Capacity in Existing Plants by FY’18.” January 1.
Ernst & Young. 2013. Global Steel 2013: A New World, a New Strategy.
Federal Reserve Board (FRB). 2014. “Industrial Production and Capacity Utilization” [data table].
Fliss, Barbara, and Tarja Mård. 2012. Taking Stock of Measures Restricting the Export of Raw Materials: Analysis of OECD Inventory Data. OECD Trade Policy Papers No. 140.
Fogarty, Steve. 2014. “U.S. Steel Announces Layoffs.” The Chronicle-Telegram, February 25.
Han, Nae Hee. 2013. Global Steel Industry and China: Future Outlook. Presentation to the Mining on Top, Stockholm, November 26–27.
Howell, Thomas R., William A. Noellert, Jesse G. Kreier, and Alan Wm. Wolff. 1988. Steel and the State: Government Intervention and Steel’s Structural Crisis. Boulder, Colo.: Westview Press.
Hufbauer, Gray Clyde, and Ben Goodrich. 2001. Steel: Big Problems, Better Solutions. Peterson Institute for International Economics Policy Brief 01-9.
Humphries, Marc. 2013. Rare Earth Elements: The Global Supply Chain. Congressional Research Service. CRS report R41347.
Industry Today. 2013.“State-Sponsored Overcapacity: The Looming Crisis in the Global Steel Industry,” vol. 16, issue 9 (last accessed April 10, 2014).
International Iron and Steel Institute (IISI). 2000. Steel Statistical Yearbook 2000.
International Iron and Steel Institute (IISI). 2003. Steel Statistical Yearbook 2003.
International Monetary Fund. 2014. World Economic Outlook Database: April 2014 Edition. Accessed April 10, 2014. http://www.imf.org/external/pubs/ft/weo/2014/01/weodata/index.aspx
KPMG. 2011. China’s 12th Five-Year Plan: Iron and Steel.
McKinsey & Company (McKinsey). 2013. Laying the Foundations for a Financially Sound Industry. Presentation at the 75th Session of the OECD Steel Committee, Paris, December 5–6.
Ministry of Commerce of the P.R. China, Investigation Bureau of Industry Injury (MOFCOM). 2013. China’s Efforts to Resolve Steel Overcapacity. Presentation at the 75th Session of the OECD Steel Committee, Paris, December 5–6.
Nezu, Risaburo. 2013. “Excess Capacity is Weighing on the Current and Future Economic Health of the Global Steel Industry, According to the OECD Steel Committee.” Statement from the chairman at the 75th Session of the OECD Steel Committee, Paris, December 6.
OECD Steel Committee (OECD). 2009. Presentation for the Council Working Party on Shipbuilding, Paris, July 9–10.
Rubio, Rafael. 2013. Global Overcapacity: A Growing Risk for the Latin American Steel Industry. Presentation at the 75th Session of the OECD Steel Committee, Paris, December 5–6.
Scott, Robert E. 2012a. The China Toll: Growing U.S. Trade Deficit with China Cost More Than 2.7 Million Jobs Between 2001 and 2011, With Job Losses in Every State. Economic Policy Institute Briefing Paper 345.
Scott, Robert E. 2012b. “U.S. Sends the Right Message with WTO Complaint on China’s Illegal Restrictions on Rare Earth Exports.” Working Economics (Economic Policy Institute blog), March 14.
Shih, Willy C., and Gary P. Pisano. 2009. “Restoring American Competitiveness.” Harvard Business Review. July-August 2009, 114–125
Silva, Filipe, Laurent Daniel, and Anthony De Carvalho. 2013. Evaluating the Current State of the Steel Industry: Work in Progress. Presentation at the 75th Session of the OECD Steel Committee, Paris, December 5.
Song, Sophie. 2014. “China Steel Overcapacity Reaching New Heights ‘Beyond Imagination.’” International Business Times, February 26.
Stanway, David, and Ruby Lian. 2012. “Analysis: China Steel Mills Too Big to Fail – or Succeed.” Reuters, May 3.
Stewart, Terence P., Amy Dwyer, and Patrick McDonough. 2002. Rules in a Rules-Based WTO: Key to Growth; The Challenges Ahead. Ardsley, N.Y.: Transnational Publishers.
United Nations (UN). 2014. Comtrade Database.
U.S. Census Bureau (U.S. Department of Commerce). 2013. “American Community Survey: Special Tabulation over 45 industries, Covering 435 Congressional Districts and the District of Columbia (113th Congress Census Boundaries), Plus State and US Totals Based on ACS 2011 1-year file” [spreadsheets received March 6].
U.S. Census Bureau (U.S. Department of Commerce). Various years. Annual Survey of Manufactures.
U.S. Department of Commerce, Import Administration (DOC). Various years. Electronic Subsidies Enforcement Library [subsidy program lists searchable by country and sector].
U.S. Department of Labor, Employment & Training Administration. Various years. Trade Adjustment Assistance Cases [database].
U.S. International Trade Commission (USITC). 1995. The Economic Effects of Antidumping and Countervailing Duty Orders and Suspension Agreements. Publication No. 2900.
U.S. International Trade Commission (USITC). 2000. Forged Stainless Steel Flanges from India and Taiwan. Publication No. 3329.
U.S. International Trade Commission (USITC). 2001. Grain-Oriented Silicon Electrical Steel from Italy and Japan. Publication No. 3396.
U.S. International Trade Commission (USITC). 2002. Circular Welded Non-Alloy Steel Pipe from China. Publication No. 3523.
U.S. International Trade Commission (USITC). 2005. Steel: Evaluation of the Effectiveness of Import Relief. Publication No. 3797.
U.S. International Trade Commission (USITC). 2006. Carbon and Certain Alloy Steel Wire Rod from China, Germany, and Turkey. Publication No. 3832.
U.S. International Trade Commission (USITC). 2007. Steel Concrete Reinforcing Bar from Belarus, China, Indonesia, Korea, Latvia, Moldova, Poland, and Ukraine. Publication No. 3933.
U.S. International Trade Commission (USITC). 2008. Circular Welded Carbon-Quality Steel Pipe from China. Publication No. 4019.
U.S. International Trade Commission (USITC). 2013a. Certain Oil Country Tubular Goods from India, Korea, The Philippines, Saudi Arabia, Taiwan, Thailand, Turkey, Ukraine, and Vietnam. Publication No. 4422.
U.S. International Trade Commission (USITC). 2013b. Certain Steel Threaded Rod from India and Thailand. Publication No. 4420.
U.S. International Trade Commission (USITC). 2013c. Diffusion-Annealed, Nickel-Plated Flat-Rolled Steel Products from Japan. Publication No. 4395.
U.S. International Trade Commission (USITC). 2013d. Grain-Oriented Electrical Steel from China, Czech Republic, Germany, Japan, Korea, Poland, and Russia. Publication No. 4439.
U.S. International Trade Commission (USITC). 2013e. Non-Oriented Electrical Steel from China, Germany, Japan, Korea, Sweden, and Taiwan. Publication No. 4441.
U.S. International Trade Commission (USITC). 2013f. Prestressed Concrete Steel Rail Tie Wire from China, Mexico, and Thailand. Publication No. 4397.
U.S. International Trade Commission (USITC). 2013g. Steel Concrete Reinforcing Bar from Mexico and Turkey. Publication No. 4432.
U.S. International Trade Commission (USITC). 2013h. Welded Stainless Steel Pressure Pipe from Malaysia, Thailand, and Vietnam. Publication No. 4413.
U.S. International Trade Commission (USITC). 2014a. “Antidumping and Countervailing Duty Orders in Place as of April 7, 2014” [spreadsheet downloaded April 9].
U.S. International Trade Commission (USITC). 2014b. Carbon and Certain Alloy Steel Wire Rod from China. Publication No. 4458.
U.S. International Trade Commission (USITC). 2014c. “Steel Threaded Rod from Thailand Does Not Injure U.S. Industry, Says USITC,” April 17.
U.S. Trade Representative (USTR). 2014. “Steel.”
World Steel Association. Various years. Annual Crude Steel Production per Country and Region 1980 – 2012.
World Steel Association. 2012. Top Steel-Producing Companies 2012.
World Steel Association. 2013a. Steel Production 2013.
World Steel Association. 2013b. Steel Statistical Yearbook 2013.
World Steel Dynamics. 2013. Economic Health of the Steel Industry: A Decade of “Pain” following a Half-Decade of “Gain?” Presentation at the 75th Session of the OECD Steel Committee, Paris, December 5–6.
World Trade Organization (WTO). Various years. Notifications by Individual Members on Anti-Dumping [semi-annual notifications searchable by country].
World Trade Organization (WTO). Various years. Notifications by Individual Members on Countervailing Measures [semi-annual notifications searchable by country].
World Trade Organization (WTO). 2013a. Anti-Dumping Initiations: By Sector 01/01/1995–30/06/2013.
World Trade Organization (WTO). 2013b. Anti-Dumping Measures: By Sector 01/01/1995– 30/06/2013.
World Trade Organization (WTO). 2013c. Countervailing Initiations: By Sector 01/01/1995– 30/06/2013.
World Trade Organization (WTO). 2013d. Countervailing Measures: By Sector 01/01/1995– 30/06/2013.
